The Total Subscription Revenue widget showing the Total Transaction Revenue, collected at the time of purchase , broken out into New [Transaction] Revenue (green) and Renewal [Transaction] Revenue (blue).
The Service Rate ID widget showing the top 10 subscription services containing active subscriptions over the last 30 full days, broken out by Service, Rate, Term, and Price.
The Conversions by Month widget showing Conversions for the last 12 full months.
The Conversions by Month widget showing the top 5 articles with the highest number of Conversions Leads in the last 30 full days.
The Audience+ Audience Sizes widget showing the top 5 Audiences for your website over the last 30 full days.
The Conversions by Access Rule widget showing Access Rules that attributed to a Conversion in the last 30 full days.
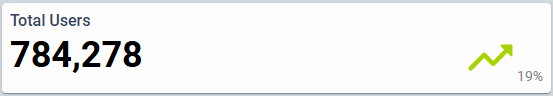
The Total Users KPI showing 784,278 unique users who viewed or loaded a page representing a 19% increase from the prior 30 day period.
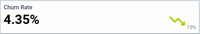
The Churned Rate industry standard KPI showing a 4.35% Churn Rate (Subscription Terminations in the given time frame / Active Subscriptions from previous time frame) representing a 15% decrease from the prior 30 day period.
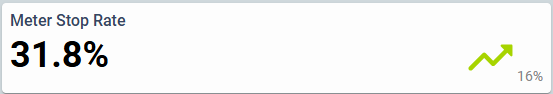
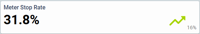
The Meter Stop Rate KPI showing a 31.8% Meter Stop Rate (Users who saw a paywall / Total Users) representing a 16% decrease from the prior 30 day period.
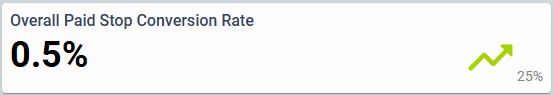
The Overall Paid Stop Conversion Rate KPI showing a 0.5% Overall Paid Stop Conversion Rate (New Active Subscriptions / Users who saw an offer) representing a 25% increase from the prior 30 day period.
blox nxt
Contact Dashboard
Overview
Continuing our promise to provide data where you work, the Contacts Dashboard contains several widgets and Key Performance Indicators (KPI) including Total Subscription Revenue, Service Rate ID, Conversions by Month, Top Assets by Conversion Leads, Audience+ Audience Sizes, Conversions by Access Rule, Total Users, Churn Rate, Meter Stop Rate, and Overall Paid Stop Conversion Rate. In addition, Total Subscribers, New Subscribers, New Registrants, Churned Subs, Meter Stops, Total Revenue, and New Revenue are displayed within the Contact Key Metric Display at the top of the Contacts Search.
These data points allow you to develop and implement strategies that can improve retention and drive growth. They can even help inform editorial decisions ensuring the website delivery news and features that your subscribers value.
The following is meant to provide an overview explaining each and, where applicable, an explanation on how it is calculated and where the data is coming from.
Total Subscription Revenue
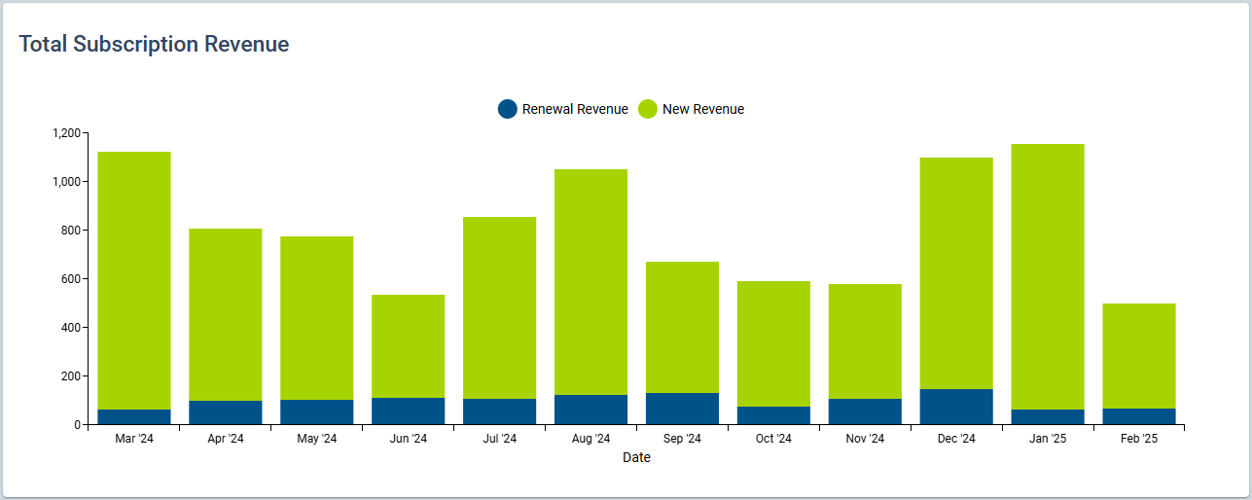
The Total Subscription Revenue widget showing the Total Transaction Revenue, collected at the time of purchase , broken out into New [Transaction] Revenue (green) and Renewal [Transaction] Revenue (blue).
The Total Subscription Revenue widget is a stacked bar chart that displays the Total Transaction Revenue collected at the time of purchase, broken out into New Transaction Revenue and Renewal Transaction Revenue, for the last 12 full months.
Hover over a bar to view New Revenue and Renewal Revenue from a specific month.
How is it calculated?
New Transaction Revenue is defined as the total amount of revenue from new subscriptions during the specified time frame, regardless of the subscription's term.
Renewal Transaction Revenue is defined as the total amount of revenue from renewing subscriptions during the specified time frame, regardless of the subscription's term.
Where is the data coming from?
Data is provided from BLOX NXT and is updated daily however, the Total Subscription Revenue widget currently won’t update until the start of the next month.
⚠️ This revenue-related data requires purchases to be collected by BLOX. It will not be available for purchases made through third-party subscription providers.
Service Rate ID
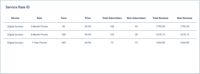
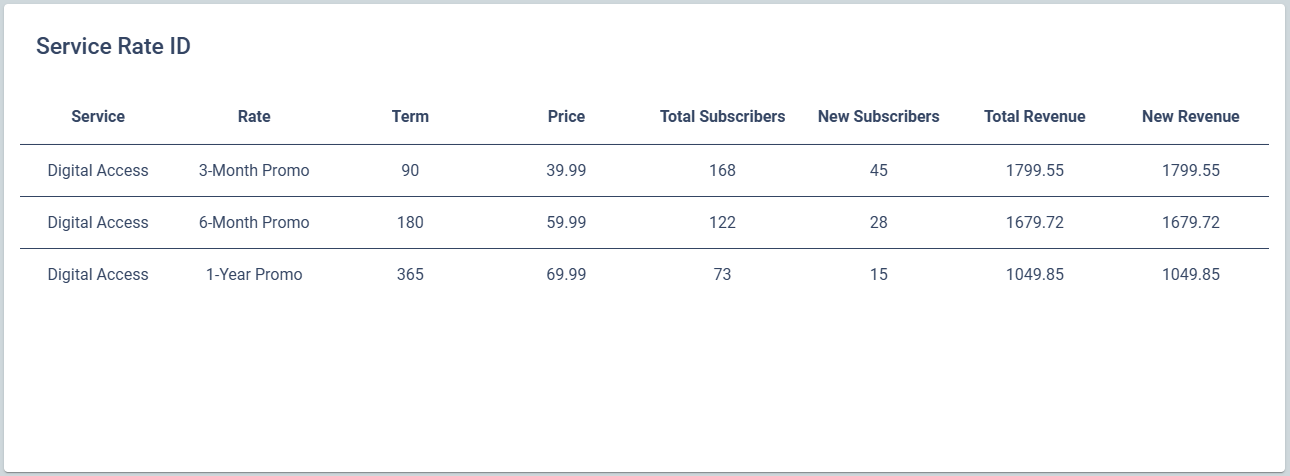
The Service Rate ID widget showing the top 10 subscription services containing active subscriptions over the last 30 full days, broken out by Service, Rate, Term, and Price.
The Service Rate ID widget is a table that displays the top 10 subscription services containing active subscriptions over the last 30 full days, broken out by Service, Rate, Term, and Price. It displays Total Subscribers (aka Active Subscriptions), New Subscribers (aka New Active Subscriptions), Total Revenue (aka Transaction Revenue), and New Revenue (aka New Transaction Revenue) sorted by Total Subscribers.
How is it calculated?
Active Subscriptions are defined as the total count of users’ activated subscriptions in the specified time frame.
New Active Subscriptions are defined as the total count of users’ activated subscriptions in the specified time frame that have not yet renewed.
Transaction Revenue is defined as the total amount of revenue from new subscriptions, combined with the revenue from renewing subscriptions, during the specified time frame, regardless of the subscription's term.
New Transaction Revenue is defined as the total amount of revenue from new subscriptions during the specified time frame, regardless of the subscription's term.
Where is the data coming from?
Data is provided from BLOX NXT and is updated daily.
⚠️ This revenue-related data requires purchases to be collected by BLOX. It will not be available for purchases made through third-party subscription providers.Additionally, subscriptions bound to third-party subscription services will appear based on their activation date (the date when the BLOX Subscription transaction was created).
Conversions by Month
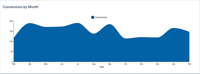
The Conversions by Month widget showing Conversions for the last 12 full months.
The Conversions by Month widget is an area chart that displays Conversions for the last 12 months.
Hover over to view conversions from a specific month.
How is it calculated?
Conversions are defined as the total of successfully completed subscription purchases (order completion events) in the specified time frame. These include users that received a paywall first and ones that did not receive a paywall.
Where is the data coming from?
Data is provided from the BLOX Google Analytics (GA) instance and is updated daily.
⚠️This conversion-related data requires purchases to be collected by BLOX (within the BLOX GA instance). It will not be available for purchases made through third-party subscription providers.
Top Assets by Conversion Leads
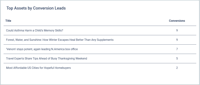
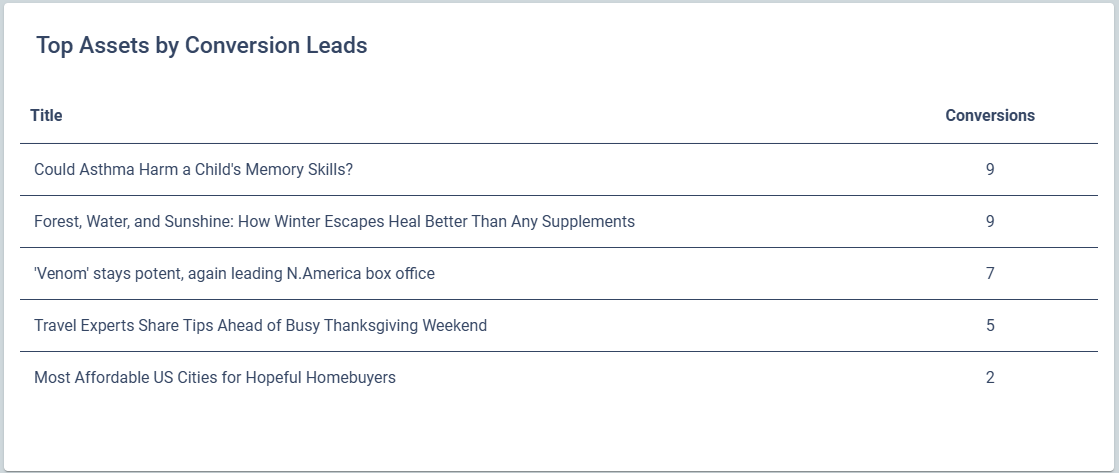
The Conversions by Month widget showing the top 5 articles with the highest number of Conversions Leads in the last 30 full days.
The Top Assets by Conversion Leads widget is a table that displays the top 5 assets (generally articles) with the highest number of Conversion Leads in the last 30 full days.
Click on a row to open the article within the Content Management Application.
How is it calculated?
Conversion Leads are defined as being one of the last 5 assets viewed prior to a Conversion.
Conversions are defined as the total of successfully completed subscription purchases (order completion events) in the specified time frame. These include users that received a paywall first and ones that did not receive a paywall.
Where is the data coming from?
Data is provided from the BLOX Google Analytics (GA) instance and is updated daily.
⚠️This conversion-related data requires purchases to be collected by BLOX (within the BLOX GA instance). It will not be available for purchases made through third-party subscription providers.
Audience+ Audience Sizes
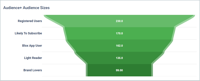
The Audience+ Audience Sizes widget showing the top 5 Audiences for your website over the last 30 full days.
The Audience+ Audience Sizes widget is a funnel chart that displays the Total Audience Size of your top 5 Audiences for your website over the last 30 full days.
These Audiences are limited to the following, Likely to Sign Up, Likely to Subscribe, Unlikely to Subscribe, Light Readers, Registered Users, Brand Lovers, Retargeting, Zombies, Freeloaders, BLOX App User, Newsletter Subscriber, Anonymous, and Formers. This data provides transparency regarding audience size. For additional information regarding Audience+ Audiences, see How do I personalize my paywalls to specific user groups?
How is it calculated?
Total Audience Size is defined as the number of Contacts that the CDP (Customer Data Platform) or BLOX NXT (in the case of Anonymous and Formers) has assigned to the given audience.
Where is the data coming from?
Data is provided from the CDP (Customer Data Platform) in addition from BLOX NXT and is updated daily.
Conversions by Access Rule
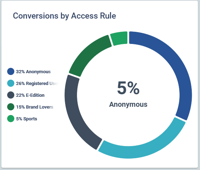
The Conversions by Access Rule widget showing Access Rules that attributed to a Conversion in the last 30 full days.
The Conversions by Access Rule widget is a pie chart that displays Access Rules that attributed to a Conversions in the last 30 full days. It displays the top 25 Access Rules have have an attributed conversion. The top Access Rule is displayed in the center of the pie chart.
Hover over the pie chart to view the Conversion percentage and Access Rule for segment.
How is it calculated?
Access Rules are configured and maintained within BLOX Audience+.
Conversions are defined as the total of successfully completed subscription purchases (order completion events) in the specified time frame. These include users that received a paywall first and ones that did not receive a paywall.
Where is the data coming from?
Data is provided from the BLOX Google Analytics (GA) instance and is updated daily.
⚠️This conversion-related data requires BLOX Audience+ and requires purchases to be collected by BLOX (within the BLOX GA instance). It will not be available for purchases made through third-party subscription providers.
Total Users
The Total Users KPI showing 784,278 unique users who viewed or loaded a page representing a 19% increase from the prior 30 day period.
The Total Users KPI displays the total count of unique Users who were associated with a Pageview Event in the last 30 full days.
That number is then compared over the previous specified time frame to come up with the percentage increase or decrease on the right.
How is it calculated?
Users are defined as a person who interacts with your website, app, product, or feature.
Pageview Event is defined as an event that is recorded when a user views or loads a page on your website.
Where is the data coming from?
Data is provided from the BLOX Google Analytics (GA) instance and is updated daily.
Churn Rate
The Churned Rate industry standard KPI showing a 4.35% Churn Rate (Subscription Terminations in the given time frame / Active Subscriptions from previous time frame) representing a 15% decrease from the prior 30 day period.
An industry standard KPI, Churn Rate is the ratio of Subscription Terminations (aka Churned Subs) in the last 30 full days over the total count of unique Active Subscriptions as of 30 full days ago.
That ratio is then compared over the previous specified time frame to come up with the percentage decrease (good!) or increase on the right.
How is it calculated?
Subscription Terminations are defined as subscriptions that have canceled, expired, reached the end of their grace period, or otherwise did not renew in the specified time frame.
Active Subscriptions are defined as the total count of users’ activated subscriptions at beginning of the specified time frame.
Where is the data coming from?
Data is provided from BLOX NXT and is updated daily.
⚠️ Subscriptions bound to third-party subscription services will appear after their activation date (the date when the BLOX Subscription transaction was created). Additionally, this metric for third-party services is dependent on users who have logged in after their subscription terminated. For the most accurate measure, partner’s using third-party subscription services should look in their circulation system of record.
Meter Stop Rate
The Meter Stop Rate KPI showing a 31.8% Meter Stop Rate (Users who saw a paywall / Total Users) representing a 16% decrease from the prior 30 day period.
An industry standard KPI, Meter Stop Rate is the ratio of unique Users who saw a paywall (recorded a Meter Stop Event) over the total number of unique Users in the last 30 full days.
That ratio is then compared over the previous specified time frame to come up with the percentage increase or decrease on the right.
How is it calculated?
Users are defined as a person who interacts with your website, app, product, or feature.
Meter Stop Event is a custom Google Analytics (GA) event (‘view_item_list’) used to track when a user views a paywall on your website.
Where is the data coming from?
Data is provided from the BLOX Google Analytics (GA) instance and is updated daily.
Overall Paid Stop Conversion Rate
The Overall Paid Stop Conversion Rate KPI showing a 0.5% Overall Paid Stop Conversion Rate (New Active Subscriptions / Users who saw an offer) representing a 25% increase from the prior 30 day period.
An industry standard KPI, Overall Paid Stop Conversion Rate is the ratio of New Active Subscriptions over the total count of unique Users who saw an offer (recorded a Product List Viewed Event) in the last 30 full days.
That ratio is then compared over the previous specified time frame to come up with the percentage increase or decrease on the right.
How is it calculated?
New Active Subscriptions are defined as the total count of users’ activated subscriptions in the specified time frame that have not yet renewed.
Users are defined as a person who interacts with your website, app, product, or feature.
Product List Viewed Event is a custom Google Analytics (GA) event used to track when a user views a paywall or an offer landing page on your website.
Where is the data coming from?
Data is provided from the BLOX Google Analytics (GA) instance in addition from BLOX NXT and is updated daily.
⚠️This conversion-related data requires purchases to be collected by BLOX (within the BLOX GA instance). It will not be available for purchases made through third-party subscription providers.
Contact Key Metric Display
The Contact Key Metric Display contains several Contact related Key Performance Indicators (KPI) including Total Subscribers, New Subscribers, New Registrants, Churned Subs, Meter Stops, Total Revenue, and New Revenue.