The Trending Content widget showing the top 10 Trending Articles within the last 30 minutes sorted by Users.
The Traffic Source widget showing traffic referrals, broken out by Traffic Source, over the last 30 full days.
The Meter Stops KPI showing 177,385 unique users that saw a paywall event representing a 38% increase from the prior 30 day period.
The Total Users KPI showing 74,835 unique users who loaded a page representing a 9% increase from the prior 30 day period.
The Views by Traffic Source widget showing Page Views broken out by Traffic Source over the last 24 full hours.
The Views widget showing Page Views over the last 30 full days.
The Bandwidth widget showing bandwidth usage for your website domain over the last 30 full days.
The Subscribers Percentage KPI showing that 15.7% of the total unique users that viewed this asset are subscribers in the last 30 full days representing a 27% increase from the prior 30 day period.
The Top Articles [by Page Views] widget showing the top 5 articles with the highest number of Page Views in the last 30 full days.
The Top Sections [by Page Views] widget showing the top 5 sections with the highest number of Page Views associated to assets (generally articles) tagged with the given primary section in the last 30 full days.
The Top Content Producers [by Page Views] widget showing the top 5 producers with the highest number of Page Views associated to assets (generally articles) tagged with the given producer in the last 30 full days.
The Devices widget showing the last 30 days of page views for the asset broken out by Device Type.
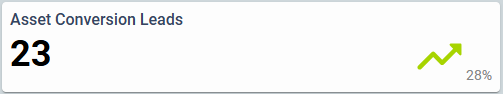
The Conversion Leads KPI showing that 23 conversion leads have been attributed to any assets on this website domain in the last 30 full days representing a 28% increase from the prior 30 day period.
The Assets Published widget showing the last 30 full days of assets published broken out by Asset Type.
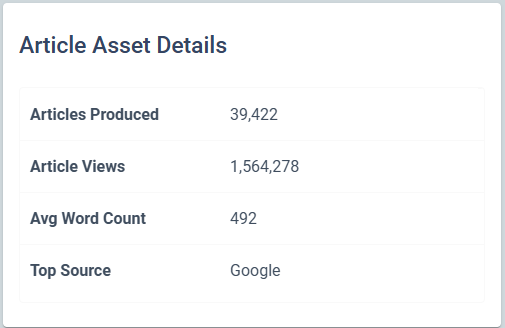
The Article Asset Details widget showing 39,422 Articles Published with an Average Word Count of 492 and 1,564,278 Article Views with a Top Source of Google over the last 30 full days.
The Video Asset Details widget showing 3,032 Videos Published, 14,240 Video Views with a Top Source of Google over the last 30 full days.
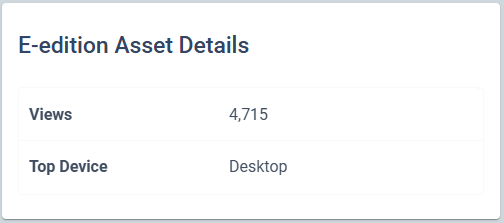
The e-Edition Asset Details widget showing 4,715 e-Edition Views with a Top Device of Desktop over the last 30 full days.
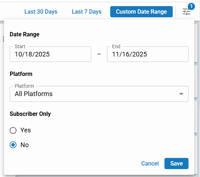
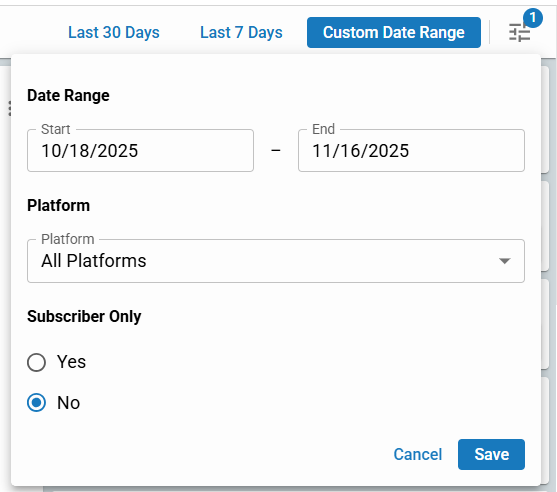
The Dashboard Filters for date range and additional data filters.
blox nxt
Content Management Dashboard
Overview
Providing data where you work, the Content Management Dashboard contains several widgets including Trending Content, Views by Traffic Source, Views, Bandwidth, Top Articles, Top Sections, Views by Content Topic, Top Content Producers, Content Producer Lookup, Total Users, Subscribers Percentage, Traffic Source, Devices, Meter Stops, Asset Conversion Leads, Article Lookup, Article Asset Details, Video Asset Details, e-Edition Asset Details, and Audiences Reached.
These data points allow you to develop and implement strategies that can improve retention and drive growth. They can even help inform editorial decisions ensuring the website delivery news and features that your subscribers value.
The following is meant to provide an overview explaining each and, where applicable, an explanation on how it is calculated and where the data is coming from.
Dashboard Filters
Under the navigation and search bar in BLOX NXT, you will find the date range filter. This allows you to quickly filter search results by Last 30 Days or Last 7 Days.
Click the filter icon to bring up more date and data filtering options.
Date Range - Select custom date ranges for your data.
Platform dropdown - Select All Platforms, or narrow down to just Web, Native App or CTV App (if applicable).
Subscriber Only radio options - Narrow your data down by only subscribers.
The Dashboard Filters for date range and additional data filters.
Trending Content
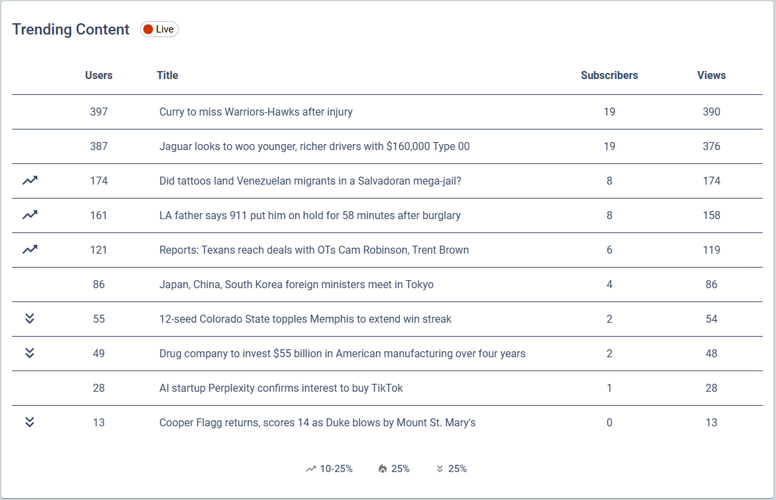
The Trending Content widget showing the top 10 Trending Articles within the last 30 minutes sorted by Users.
The Trending Content widget is a table that displays the top 10 Trending Articles, sorted by Users, within the last 30 minutes . Along with the Article Title, it displays Users (Users with Pageview) and Subscribers (Subscribers with Pageview) that recorded a View (Pageview Event) for each article.
Click on a row to open the article within the Content Management Application.
How is it calculated?
Users with Pageview are defined as individual visitors who had at least one Pageview Event on your website.
Subscribers with Pageview are defined as individual active subscribers who had at least one Pageview Event on your website.
Pageview Event is defined as an event that is recorded when a user views or loads a page on your website.
Where is the data coming from?
Data is provided from the “GA4 Realtime API” and provides near real-time updates (less than a minute).
Views by Traffic Source
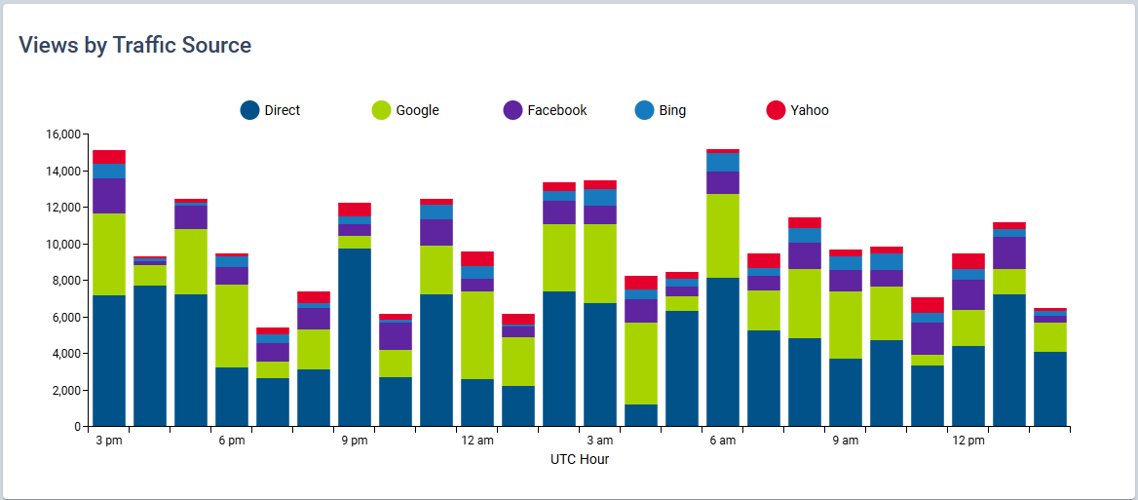
The Views by Traffic Source widget showing Page Views broken out by Traffic Source over the last 24 full hours.
The Views by Traffic Source widget is a stacked bar chart that displays Page Views (Pageview Events) broken out by Traffic Source (Direct, Facebook, Yahoo, Google, Bing, etc.) within the 24 full hours.
Hover over the stacked bar chart to view page and article views from a specific day.
How is it calculated?
Pageview Events are defined as an event that is recorded when a user views or loads a page on your website.
Where is the data coming from?
Data is provided from the BLOX GA instance and is updated hourly.
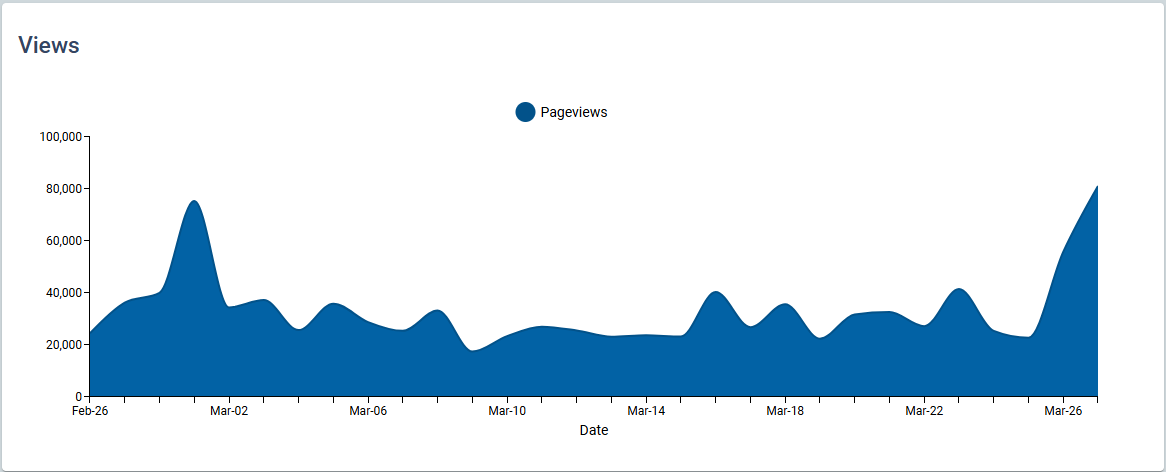
Views
The Views widget showing Page Views over the last 30 full days.
The Views widget is an area chart that displays Page Views (Pageview Events) over the last 30 full days.
Hover over the area chart to view page views from a specific day.
How is it calculated?
Pageview Events are defined as an event that is recorded when a user views or loads a page on your website.
Where is the data coming from?
Data is provided from the BLOX GA instance and is updated daily.
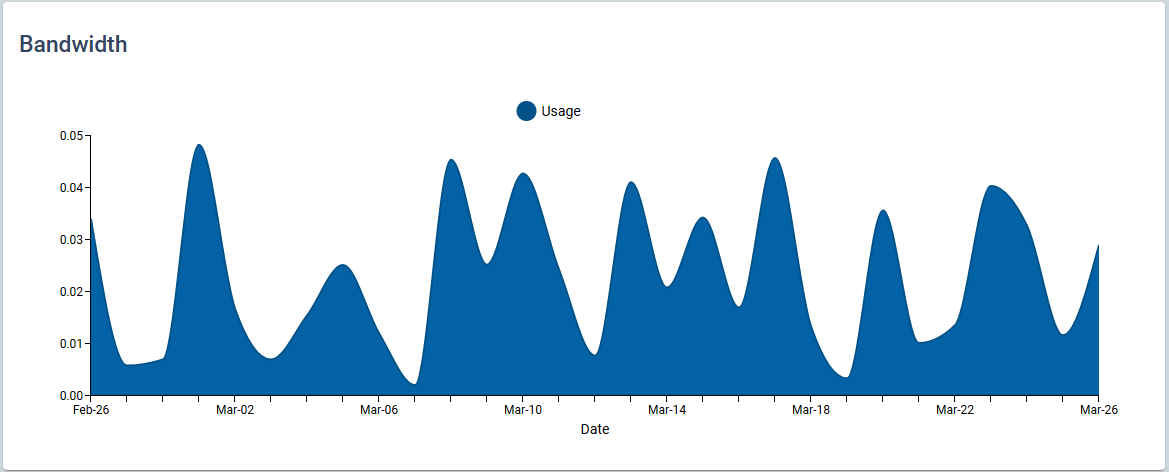
Bandwidth
The Bandwidth widget showing bandwidth usage for your website domain over the last 30 full days.
The Bandwidth widget is an area chart that displays Bandwidth Usage (in GB) for your website domain over the last 30 full days.
Hover over the area chart to view bandwidth usage from a specific day.
How is it calculated?
Bandwidth Usage is defined as the total amount of data your website traffic consumes.
Where is the data coming from?
Data is provided from the BLOX Analytics and is updated daily.
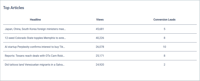
Top Articles
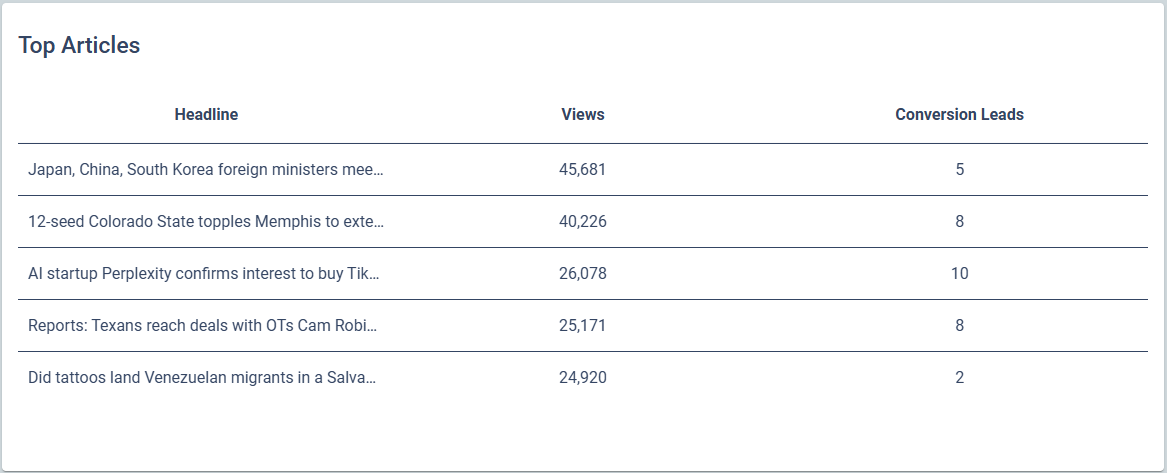
The Top Articles [by Page Views] widget showing the top 5 articles with the highest number of Page Views in the last 30 full days.
The Top Articles [by Page Views] widget is a table that displays the top 5 articles with the highest number of Page Views (Pageview Events) in the last 30 full days. Conversion Leads for the articles are also displayed.
How is it calculated?
Pageview Events are defined as an event that is recorded when a user views or loads a page on your website.
Conversion Leads are defined as being one of the last 5 assets viewed prior to a Conversion.
Conversions are defined as the total of successfully completed subscription purchases (order completion events) in the specified time frame. These include users that received a paywall first and ones that did not receive a paywall.
Where is the data coming from?
Data is provided from the BLOX Google Analytics (GA) instance and is updated daily.
⚠️This conversion-related data requires purchases to be collected by BLOX (within the BLOX GA instance). It will not be available for purchases made through third-party subscription providers (Conversion Leads will display as 0 in these instances).
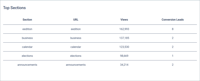
Top Sections
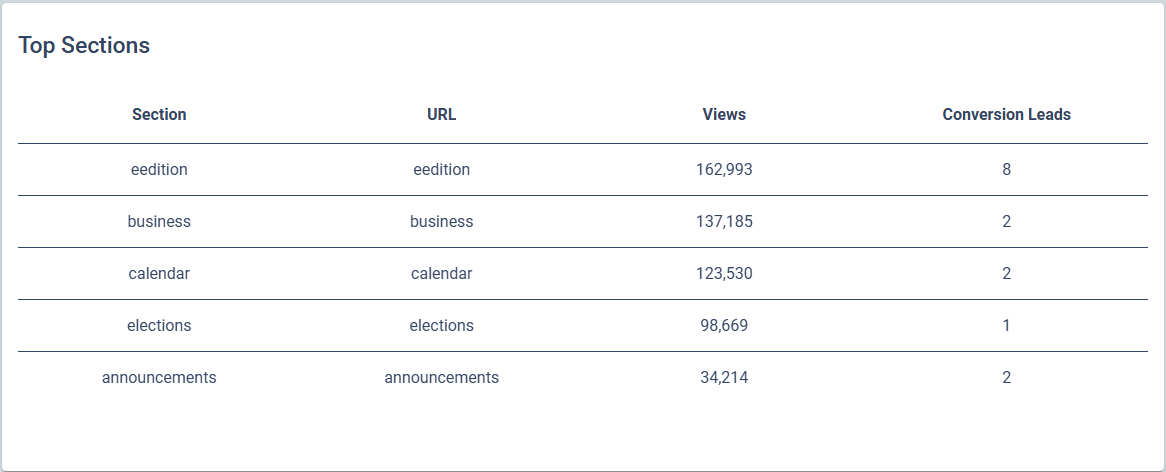
The Top Sections [by Page Views] widget showing the top 5 sections with the highest number of Page Views associated to assets (generally articles) tagged with the given primary section in the last 30 full days.
The Top Sections [by Page Views] widget is a table that displays the top 5 sections with the highest number of Page Views (Pageview Events) associated to assets (generally articles) tagged with the given primary section in the last 30 full days. Conversion Leads for articles associated to the given primary section are also displayed.
How is it calculated?
Pageview Events are defined as an event that is recorded when a user views or loads a page on your website.
Conversion Leads are defined as being one of the last 5 assets viewed prior to a Conversion.
Conversions are defined as the total of successfully completed subscription purchases (order completion events) in the specified time frame. These include users that received a paywall first and ones that did not receive a paywall.
Where is the data coming from?
Data is provided from the BLOX Google Analytics (GA) instance and is updated daily.
⚠️This conversion-related data requires purchases to be collected by BLOX (within the BLOX GA instance). It will not be available for purchases made through third-party subscription providers (Conversion Leads will display as 0 in these instances).
Views by Content Topic
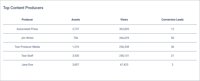
Top Content Producers
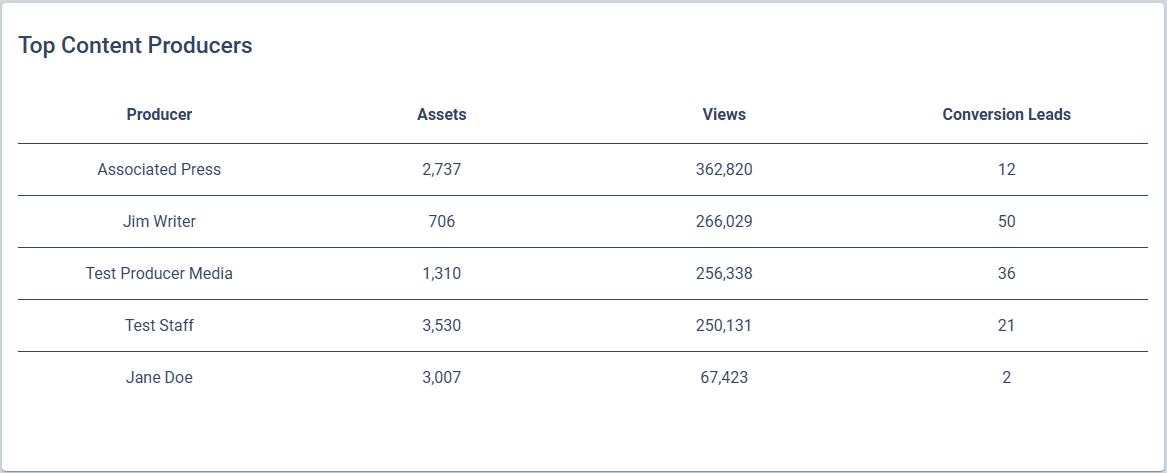
The Top Content Producers [by Page Views] widget showing the top 5 producers with the highest number of Page Views associated to assets (generally articles) tagged with the given producer in the last 30 full days.
The Top Content Producers [by Page Views] widget is a table that displays the top 5 producers with the highest number of Page Views (Pageview Events) associated to assets (generally articles) that they created in the last 30 full days. The number of assets the producer created and Conversion Leads for articles associated to the producer are also displayed.
How is it calculated?
Pageview Events are defined as an event that is recorded when a user views or loads a page on your website.
Conversion Leads are defined as being one of the last 5 assets viewed prior to a Conversion.
Conversions are defined as the total of successfully completed subscription purchases (order completion events) in the specified time frame. These include users that received a paywall first and ones that did not receive a paywall.
Where is the data coming from?
Data is provided from the BLOX Google Analytics (GA) instance and is updated daily.
⚠️This conversion-related data requires purchases to be collected by BLOX (within the BLOX GA instance). It will not be available for purchases made through third-party subscription providers (Conversion Leads will display as 0 in these instances).
Content Producer Lookup
Total Users
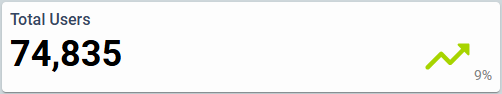
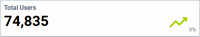
The Total Users KPI showing 74,835 unique users who loaded a page representing a 9% increase from the prior 30 day period.
The Total Users KPI displays the total count of unique Users who were associated with a Pageview Event in the last 30 full days.
That number is then compared over the previous specified time frame to come up with the percentage increase or decrease on the right.
How is it calculated?
Users are defined as a person who interacts with your website, app, product, or feature.
Pageview Event is defined as an event that is recorded when a user views or loads a page on your website.
Where is the data coming from?
Data is provided from the BLOX Google Analytics (GA) instance and is updated daily.
Subscribers Percentage
The Subscribers Percentage KPI showing that 15.7% of the total unique users that viewed this asset are subscribers in the last 30 full days representing a 27% increase from the prior 30 day period.
The Subscribers Percentage KPI is a metric expressed as a percentage that displays the proportion of Unique Subscribers who were associated with a Pageview Event for the asset relative to the number of Unique Users who were associated with a Pageview Event for the asset in the last 30 full days.
That percentage is then compared over the previous 30 full day period to come up with the percentage increase or decrease on the right.
How is it calculated?
Unique Subscribers are defined as individual subscribers who had at least one session on your website.
Unique Users are defined as individual visitors who had at least one session on your website.
Pageview Events are defined as an event that is recorded when a user views or loads the asset on your website.
Where is the data coming from?
Data is provided from the BLOX Google Analytics (GA) instance and is updated daily.
Traffic Source
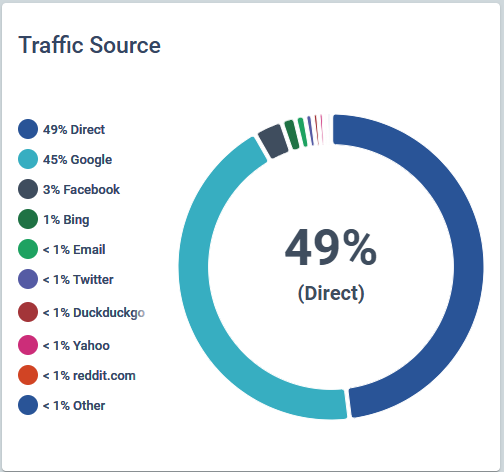
The Traffic Source widget showing traffic referrals, broken out by Traffic Source, over the last 30 full days.
The Traffic Source widget is a pie chart that displays traffic referrals, broken out by Traffic Source, over the last 30 full days. It displays the top 9 traffic sources and groups the remaining sources into a 10th traffic source of ‘Other’. The top Traffic Source is displayed in the center of the pie chart.
Hover over the pie chart to view the percentage of traffic referrals and Traffic Source for each segment.
How is it calculated?
Traffic Source is defined as the exact domain or platform that sends visitors to your website. It provides crucial insights into how users discover and access your site.
Where is the data coming from?
Data is provided from the BLOX GA instance and is updated daily.
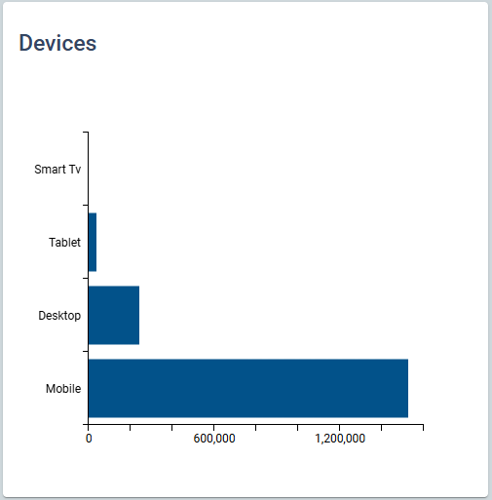
Devices
The Devices widget showing the last 30 days of page views for the asset broken out by Device Type.
The Devices widget is a bar chart that displays the last 30 full days of Page Views (Pageview Events) for this asset broken out by Device Type (Mobile, Desktop, Tablet, and Smart tv).
Hover over the bar chart to view the total number of page views from a specific Device Type.
How is it calculated?
Pageview Events are defined as an event that is recorded when a user views or loads a page on your website.
Where is the data coming from?
Data is provided from the BLOX Google Analytics (GA) instance and is updated daily.
Meter Stops
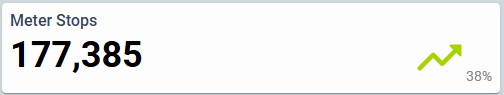
The Meter Stops KPI showing 177,385 unique users that saw a paywall event representing a 38% increase from the prior 30 day period.
The Meter Stops KPI displays the total count of unique Users that saw a paywall (recorded a Meter Stop Event) in the last 30 full days.
That number is then compared over the previous specified time frame to come up with the percentage increase or decrease on the right.
How is it calculated?
Users are defined as a person who interacts with your website, app, product, or feature.
Meter Stop Event is a custom Google Analytics (GA) event (‘view_item_list’) used to track when a user views a paywall on your website.
Where is the data coming from?
Data is provided from the BLOX Google Analytics (GA) instance and is updated daily.
Asset Conversion Leads
The Conversion Leads KPI showing that 23 conversion leads have been attributed to any assets on this website domain in the last 30 full days representing a 28% increase from the prior 30 day period.
The Conversion Leads KPI displays the number of Conversion Leads associated to any assets (opposed to something like a landing page) on this website domain in the last 30 full days.
That number is then compared over the previous 30 full day period to come up with the percentage increase or decrease on the right.
How is it calculated?
Conversion Leads are defined as being one of the last 5 assets viewed prior to a Conversion.
Where is the data coming from?
Data is provided from the BLOX Google Analytics (GA) instance and is updated daily.
⚠️This conversion-related data requires purchases to be collected by BLOX (within the BLOX GA instance). It will not be available for purchases made through third-party subscription providers.
Assets Published
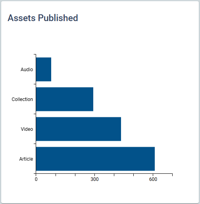
The Assets Published widget showing the last 30 full days of assets published broken out by Asset Type.
The Assets Published widget displays the total unique Assets Published broken out by Asset Type (Article, Video, Collection, and Audio) in the last 30 full days.
Hover over the bar chart to view the total number of assets published from a specific Asset Type.
How is it calculated?
Assets Published are defined as any asset with a Publication date / Start date during the specified time frame.
Where is the data coming from?
Data is provided from BLOX NXT and is updated daily.
Article Lookup
Article Asset Details
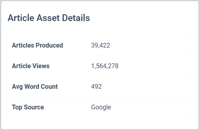
The Article Asset Details widget showing 39,422 Articles Published with an Average Word Count of 492 and 1,564,278 Article Views with a Top Source of Google over the last 30 full days.
The Article Asset Details widget displays the number of Articles Produced (aka Articles Published) the number of Page Views (Pageview Events), Average Word Count of the Articles Produced, and the Top Source (aka Traffic Source) with the highest number of traffic referrals for the Articles Produced over the last 30 full days
How is it calculated?
Articles Published are defined as any article type asset with a Publication date / Start date during the specified time frame.
Pageview Events are defined as an event that is recorded when a user views or loads a page on your website.
Traffic Source is defined as the exact domain or platform that sends visitors to your website. It provides crucial insights into how users discover and access your site.
Where is the data coming from?
Data is provided from the BLOX Google Analytics (GA) instance and is updated daily.
Video Asset Details
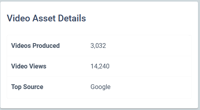
The Video Asset Details widget showing 3,032 Videos Published, 14,240 Video Views with a Top Source of Google over the last 30 full days.
The Video Asset Details widget displays the number of Videos Produced (aka Videos Published), the number of Video Views (aka Pageview Events), and the Top Source (aka Traffic Source) with the highest number of traffic referrals for the Videos Produced over the last 30 full days
How is it calculated?
Video Published are defined as any video type asset with a Publication date / Start date during the specified time frame.
Pageview Events are defined as an event that is recorded when a user views or loads a page on your website.
Traffic Source is defined as the exact domain or platform that sends visitors to your website. It provides crucial insights into how users discover and access your site.
Where is the data coming from?
Data is provided from the BLOX Google Analytics (GA) instance and is updated daily.
e-Edition Asset Details
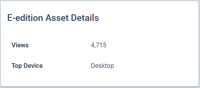
The e-Edition Asset Details widget showing 4,715 e-Edition Views with a Top Device of Desktop over the last 30 full days.
The e-Edition Asset Details widget displays the number of Page Views (aka Pageview Events) and the Top Device (aka Device Type) with the highest number of Pageview Events for the e-Editions Produced over the last 30 full days.
How is it calculated?
Pageview Events are defined as an event that is recorded when a user views or loads a page on your website.
Device Type is defined as a categorization of the hardware platform used by a visitor to interact with your website. Device type is divided into three categories; desktop, mobile, and tablet.
Where is the data coming from?
Data is provided from the BLOX Google Analytics (GA) instance and is updated daily.
Audiences Reached
Editorial Key Metric Display
The Editorial Key Metric Display contains a number of Editorial related Key Performance Indicators (KPI) including [Total] Assets Published, Views, Total Users, Top Source, and Top Device.