Providing data where you work, the Editorial Dashboard contains several widgets including Trending Content, Views by Traffic Source, Views, Bandwidth, Top Articles, Top Sections, Views by Content Topic, Top Content Producers, Content Producer Lookup, Total Users, Subscribers Percentage, Traffic Source, Devices, Meter Stops, Asset Conversion Leads, Article Lookup, Article Asset Details, Video Asset Details, e-Edition Asset Details, and Audiences Reached.
The Contact Key Metric Display contains several Contact related Key Performance Indicators (KPI) including Total Subscribers, New Subscribers, New Registrants, Churned Subscribers, Meter Stops, Total Subscription Revenue, and New Subscription Revenue.
The Editorial Key Metric Display contains several Editorial related Key Performance Indicators (KPI) including Assets Published, Views, Total Users, Top Source, and Top Device.
The Home Dashboard contains several widgets including Trending Content, Views, Updates & Insights from BLOX Digital, Traffic Source, Need Help, Service Updates, and Software Release.
Continuing our promise to provide data where you work, the Contacts Dashboard contains several widgets and Key Performance Indicators (KPI) including Total Subscription Revenue, Service Rate ID, Conversions by Month, Top Assets by Conversion Leads, Audience+ Audience Sizes, Conversions by Access Rule, Total Users, Churn Rate, Meter Stop Rate, and Overall Paid Stop Conversion Rate. In addition, Total Subscribers, New Subscribers, New Registrants, Churned Subs, Meter Stops, Total Revenue, and New Revenue are displayed within the Contact Key Metric Display at the top of the Contacts Search.
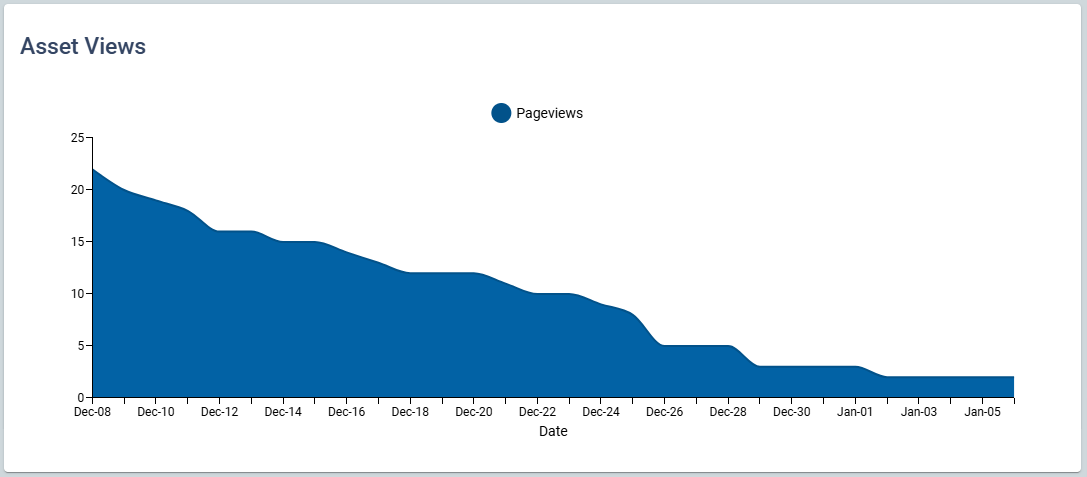
The Editorial Asset Dashboard contains several widgets and KPI including Asset Views, Audiences Reached, Trending Content Rank, Meter Stops, Total Users, Subscribers Percentage, Asset Conversion Leads, Content Longevity, Asset Devices, and Traffic Source. The following is meant to provide an overview explaining each and, where applicable, an explanation on how it is calculated and where the data is coming from.
The Home Interface consists of several key parts, these include the Home Dashboard and an introduction to the concept of ‘Data where you work’, Bento Navigation allowing navigation between applications, Site Selection, Application Navigation, and the Omni Search. In addition the Home Interface contains a Create Shortcut and Profile Options.
If you are part of BLOX Digital revenue programs you will receive your reporting through DOMO dashboards. Below find how to use those dashboards.
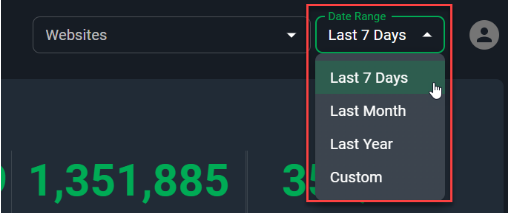
Displays historical performance of your site for up to the last 12 months. Populates data from the previous day by noon central time.