The Views KPI showing 232,759 total page view events representing a 18% increase from the prior 30 day period.
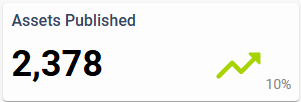
The Assets Published KPI showing 2,378 unique assets published in the last 30 full days representing a 10% increase from the prior 30 day period.
The Total Users KPI showing 74,835 unique users who loaded a page representing a 9% increase from the prior 30 day period.
The Top Source KPI showing Google as the domain that has sent the highest number of traffic referrals to your site.
The Top Device KPI showing Desktop as the device type with the highest number of pageview events over the last 30 full days.
blox nxt
Asset Search Key Metric Display
Overview
The Editorial Key Metric Display contains several Editorial related Key Performance Indicators (KPI) including Assets Published, Views, Total Users, Top Source, and Top Device.
The following is meant to provide an overview explaining each and, where applicable, an explanation on how it is calculated and where the data is coming from.
📝 All of the Key Metric Display default to a period of the last 30 full days. Clicking on the calendar and updating the Start and End Change Date Range does not update this default period today.
Assets Published
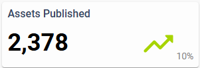
The Assets Published KPI showing 2,378 unique assets published in the last 30 full days representing a 10% increase from the prior 30 day period.
The Assets Published KPI displays the total unique Assets Published in the last 30 full days.
That number is then compared over the previous specified time frame to come up with the percentage increase or decrease on the right.
How is it calculated?
Assets Published are defined as any asset with a Publication date / Start date during the specified time frame.
Where is the data coming from?
Data is provided from BLOX NXT and is updated daily.
Views
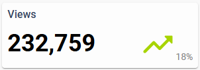
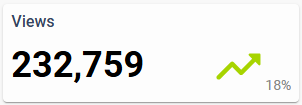
The Views KPI showing 232,759 total page view events representing a 18% increase from the prior 30 day period.
The Views KPI displays the total Pageview Events over the last 30 full days.
That number is then compared over the previous specified time frame to come up with the percentage increase or decrease on the right.
How is it calculated?
Pageview Events are defined as an event that is recorded when a user views or loads a page on your website.
Where is the data coming from?
Data is provided from the BLOX Google Analytics (GA) instance and is updated daily.
Total Users
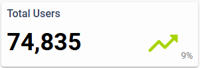
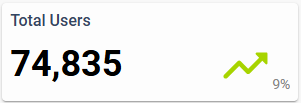
The Total Users KPI showing 74,835 unique users who loaded a page representing a 9% increase from the prior 30 day period.
The Total Users KPI displays the total count of unique Users who were associated with a Pageview Event in the last 30 full days.
That number is then compared over the previous specified time frame to come up with the percentage increase or decrease on the right.
How is it calculated?
Users are defined as a person who interacts with your website, app, product, or feature.
Pageview Event is defined as an event that is recorded when a user views or loads a page on your website.
Where is the data coming from?
Data is provided from the BLOX Google Analytics (GA) instance and is updated daily.
Top Source
The Top Source KPI showing Google as the domain that has sent the highest number of traffic referrals to your site.
The Top Source KPI displays the Traffic Source with the highest number of traffic referrals over the last 30 full days.
How is it calculated?
Traffic Source is defined as the exact domain or platform that sends visitors to your website. It provides crucial insights into how users discover and access your site.
Where is the data coming from?
Data is provided from the BLOX Google Analytics (GA) instance and is updated daily.
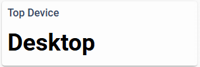
Top Device
The Top Device KPI showing Desktop as the device type with the highest number of pageview events over the last 30 full days.
The Top Device KPI displays the Device Type with the highest number of Pageview Events over the last 30 full days.
How is it calculated?
Device Type is defined as a categorization of the hardware platform used by a visitor to interact with your website. Device type is divided into three categories; desktop, mobile, and tablet.
Pageview Events are defined as an event that is recorded when a user views or loads a page on your website.
Where is the data coming from?
Data is provided from the BLOX Google Analytics (GA) instance and is updated daily.