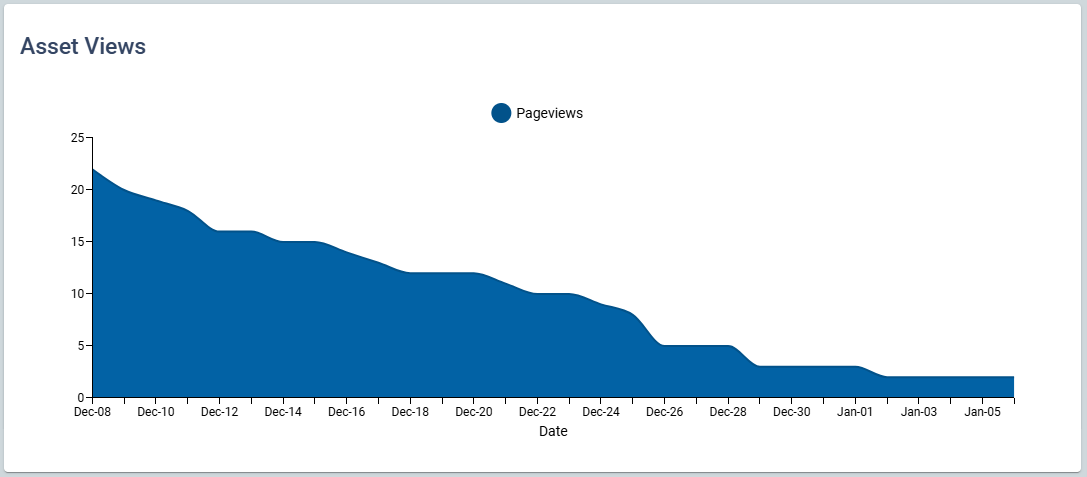
Providing data where you work, the Editorial Dashboard contains several widgets including Trending Content, Views by Traffic Source, Views, Bandwidth, Top Articles, Top Sections, Views by Content Topic, Top Content Producers, Content Producer Lookup, Total Users, Subscribers Percentage, Traffic Source, Devices, Meter Stops, Asset Conversion Leads, Article Lookup, Article Asset Details, Video Asset Details, e-Edition Asset Details, and Audiences Reached.
The Editorial Key Metric Display contains several Editorial related Key Performance Indicators (KPI) including Assets Published, Views, Total Users, Top Source, and Top Device.
The Home Dashboard contains several widgets including Trending Content, Views, Updates & Insights from BLOX Digital, Traffic Source, Need Help, Service Updates, and Software Release.
The Editorial Asset Dashboard contains several widgets and KPI including Asset Views, Audiences Reached, Trending Content Rank, Meter Stops, Total Users, Subscribers Percentage, Asset Conversion Leads, Content Longevity, Asset Devices, and Traffic Source. The following is meant to provide an overview explaining each and, where applicable, an explanation on how it is calculated and where the data is coming from.
