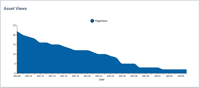
The Asset Views widget showing the last 30 days of page views for the asset.
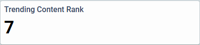
The Trending Content Rank KPI showing that this asset currently ranks 7th in page views when comparing to like asset types.
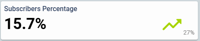
The Subscribers Percentage KPI showing that 15.7% of the total unique users that viewed this asset are subscribers in the last 30 full days representing a 27% increase from the prior 30 day period.
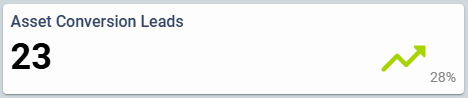
The Asset Conversion Leads KPI showing that 23 conversion leads have been attributed to this asset in the last 30 full days representing a 28% increase from the prior 30 day period.
The Content Longevity KPI showing that this asset has generated at least 1 page view for 23 of the last 30 full days.
The Asset Devices widget showing the last 30 days of page views for the asset broken out by Device Type.
blox nxt beta
Editorial Asset Dashboard
Overview
The Editorial Asset Dashboard contains several widgets and KPI including Asset Views, Audiences Reached, Trending Content Rank, Meter Stops, Total Users, Subscribers Percentage,Asset Conversion Leads, Content Longevity, Asset Devices, and Traffic Source. The following is meant to provide an overview explaining each and, where applicable, an explanation on how it is calculated and where the data is coming from.
📝 The Editorial Asset Dashboard will only be available after an asset has been published initially (Published: Yes) and after its Publication Date (Start date/time).
⚠️ BETA. Please pardon our dust, this area is under construction. ⚠️
Asset Views
The Asset Views widget showing the last 30 days of page views for the asset.
The Asset Views widget is an area chart that displays the last 30 full days of Page Views for the asset.
Hover over the area chart to view page and article views from a specific day.
How is it calculated?
Page Views (aka Pageview Events) are defined as an event that is recorded when a user views or loads the asset on your website.
Where is the data coming from?
Data is provided from the BLOX GA instance and is updated daily.
Audiences Reached
⚠️ BETA. Please pardon our dust, this area is under construction. ⚠️
The Audiences Reached widget is a table that displays the top 5 Audiences and corresponding Audience Size that recorded a Page Views for the asset within the last 30 days.
How is it calculated?
Audience Size is defined as the number of Contacts that the CDP (Customer Data Platform) or BLOX NXT (in the case of Anonymous and Formers) has to the given audience who were associated with a Page View for the asset.
Page Views (aka Pageview Events) are defined as an event that is recorded when a user views or loads the asset on your website.
Where is the data coming from?
Data is provided from the CDP (Customer Data Platform), BLOX NXT, and BLOX GA and is updated daily.
Trending Content Rank
The Trending Content Rank KPI showing that this asset currently ranks 7th in page views when comparing to like asset types.
The Trending Content Rank KPI displays the rank of the asset in reference to the Trending Content widget on the Home Dashboard filtered by asset type.
📝While the Trending Content widget on the Home Dashboard is limited to displaying the top 10 trending articles assets, there is no such limit to the numerical ranking of a given asset. A rank of 0 means that there were no Pageview Events associated with the asset.
How is it calculated?
See Trending Content on the Home Dashboard for additional details.
Where is the data coming from?
Data is provided from the “GA4 Realtime API” and provides near real-time updates (less than a minute).
Meter Stops
The Meter Stops KPI displays the last 30 full days of Meter Stop Events for the asset.
That number is then compared over the previous 30 full day period to come up with the percentage increase or decrease on the right.
How is it calculated?
Meter Stop Events are defined as the number of ‘view_item_list’ events. This is a custom Google Analytics (GA) event used to track when a user views a paywall for the asset.
Where is the data coming from?
Data is provided from the BLOX Google Analytics (GA) instance and is updated daily.
Total Users
The Total Users KPI displays the last 30 full days of Unique Users who were associated with a Pageview Event for the asset.
That number is then compared over the previous 30 full day period to come up with the percentage increase or decrease on the right.
How is it calculated?
Unique Users are defined as individual visitors who had at least one session on your website.
Pageview Events are defined as an event that is recorded when a user views or loads the asset on your website.
Where is the data coming from?
Data is provided from the BLOX Google Analytics (GA) instance and is updated daily.
Subscribers Percentage
The Subscribers Percentage KPI showing that 15.7% of the total unique users that viewed this asset are subscribers in the last 30 full days representing a 27% increase from the prior 30 day period.
The Subscribers Percentage KPI is a metric expressed as a percentage that displays the proportion of Unique Subscribers who were associated with a Pageview Event for the asset relative to the number of Unique Users who were associated with a Pageview Event for the asset in the last 30 full days.
That percentage is then compared over the previous 30 full day period to come up with the percentage increase or decrease on the right.
How is it calculated?
Unique Subscribers are defined as individual subscribers who had at least one session on your website.
Unique Users are defined as individual visitors who had at least one session on your website.
Pageview Events are defined as an event that is recorded when a user views or loads the asset on your website.
Where is the data coming from?
Data is provided from the BLOX Google Analytics (GA) instance and is updated daily.
Asset Conversion Leads
The Asset Conversion Leads KPI showing that 23 conversion leads have been attributed to this asset in the last 30 full days representing a 28% increase from the prior 30 day period.
The Asset Conversion Leads KPI displays the number of Conversion Leads associated to this asset in the last 30 full days.
That number is then compared over the previous 30 full day period to come up with the percentage increase or decrease on the right.
How is it calculated?
Conversion Leads are defined as being one of the last 5 assets viewed prior to a Conversion.
Where is the data coming from?
Data is provided from the BLOX Google Analytics (GA) instance and is updated daily.
⚠️This conversion-related data requires purchases to be collected by BLOX (within the BLOX GA instance). It will not be available for purchases made through third-party subscription providers.
Content Longevity
The Content Longevity KPI showing that this asset has generated at least 1 page view for 23 of the last 30 full days.
The Content Longevity KPI displays the number of days the asset generated at least 1 Page View over the last 30 full days.
How is it calculated?
Page Views (aka Pageview Events) are defined as an event that is recorded when a user views or loads the asset on your website.
Where is the data coming from?
Data is provided from the BLOX GA instance and is updated daily.
Asset Devices
The Asset Devices widget showing the last 30 days of page views for the asset broken out by Device Type.
The Asset Devices widget is a bar chart that displays the last 30 full days of Page Views for this asset broken out by Device Type (Mobile, Desktop, Tablet, and Smart tv).
Hover over the bar chart to view the total number of page views from a specific Device Type.
How is it calculated?
Page Views (aka Pageview Events) are defined as an event that is recorded when a user views or loads the asset on your website.
Where is the data coming from?
Data is provided from the BLOX Google Analytics (GA) instance and is updated daily.
Traffic Source
The Traffic Source widget is a pie chart that displays the last 30 full days of traffic referrals for this asset broken out by Traffic Source. It displays the top 9 traffic sources and groups the remaining sources into a 10th traffic source of ‘Other’. The top Traffic Source is displayed in the center of the pie chart.
Hover over the pie chart to view the percentage of traffic referrals and Traffic Source for each segment.
How is it calculated?
Traffic Source is defined as the exact domain or platform that sends visitors to your website. It provides crucial insights into how users discover and access the asset.
Where is the data coming from?
Data is provided from the BLOX GA instance and is updated daily.