Displays historical performance of your site for up to the last 12 months. Populates data from the previous day by noon central time.
Website filters remain the same and carry over from the Trending Dashboard.
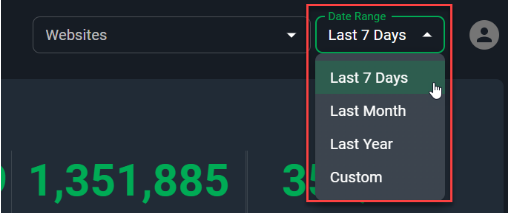
As this dashboard is displaying historical performance it introduces a Date Range filter with: Last 7 days, Last Week, Last Month and Custom Range (static selection).
The data that populates this dashboard comes from GA and BLOX.
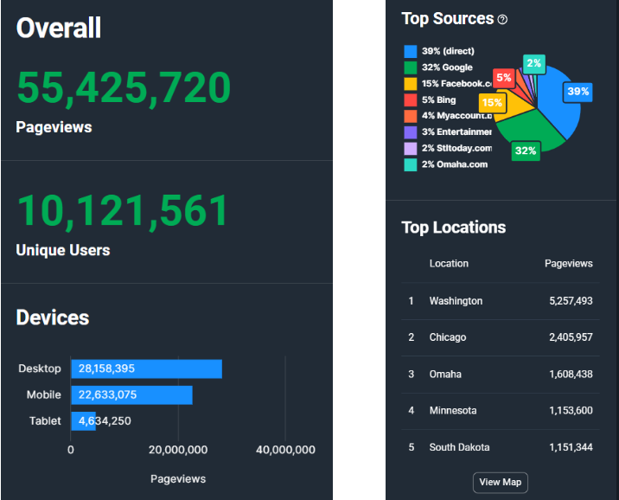
Overall Section
- Pageviews - pageviews across domains selected. This includes section, index, e-edition and business directory pages.
- Unique Users - users unique to this timeframe.
- Devices - pageview by device type
- Top Sources - top 8 sources of traffic leading users to a site
- Top Locations - top 5 locations of pageviews. Note that users may block Google from seeing their direct location. If a city is not available, the data will return a state.
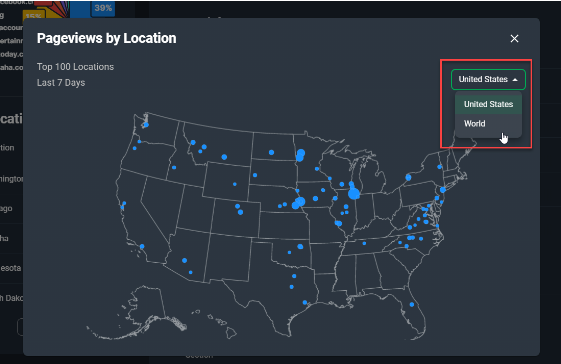
- View Map button on Top Locations - click the button to view a map of the US and visually see the distribution of the Top 100 locations by pageviews and their sizing. Click the dropdown with ‘United States’ listed to switch to a world view.
Content Section
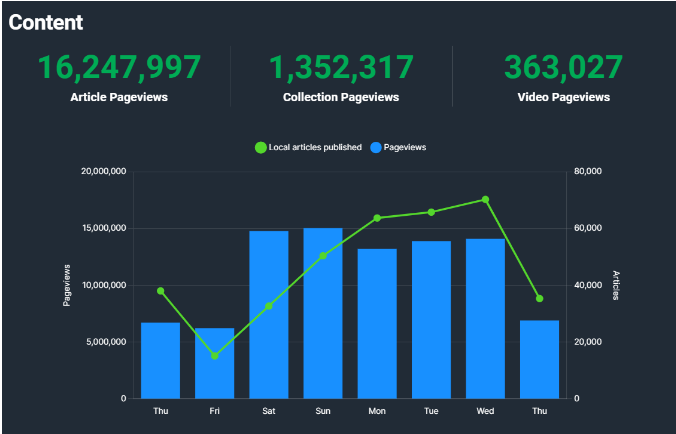
- Article Pageviews - pageviews from article asset types
- Collection Pageviews - pageviews from collection asset types
- Video Pageviews - pageviews from video asset types. Note if a video is embedded in an article it will count as an article pageview.
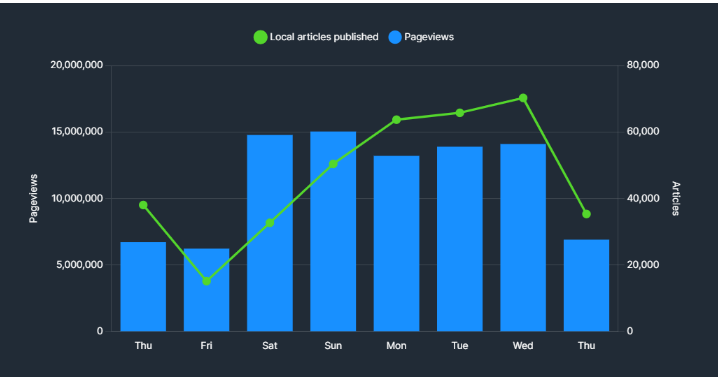
- Local articles published and Pageviews graph - A graph showing the relationship of local articles produced and site pageviews. The left access shows the scale of pageviews and the right axis shows the scale of articles.
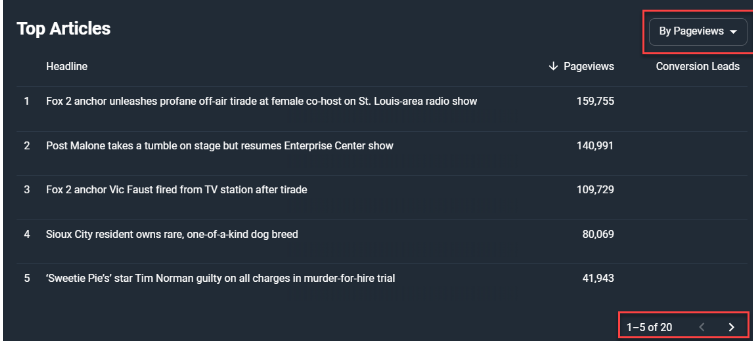
- Top Articles - a table showing Top Articles on sites by either pageviews or conversion leads.
- To change from pageviews to conversion leads click the dropdown in the upper right of the module and select Conversion Leads.
- To navigate to another page of results, click the right arrow of the pagination at the bottom of the module.
- Conversion Leads - this is populated by a Townnews custom event that provides credit to an asset if it was one of the last five assets a user viewed before converting. This is not cross domain and will only populate for clients who have purchases go through Blox Subscriptions or Audience+ customers.
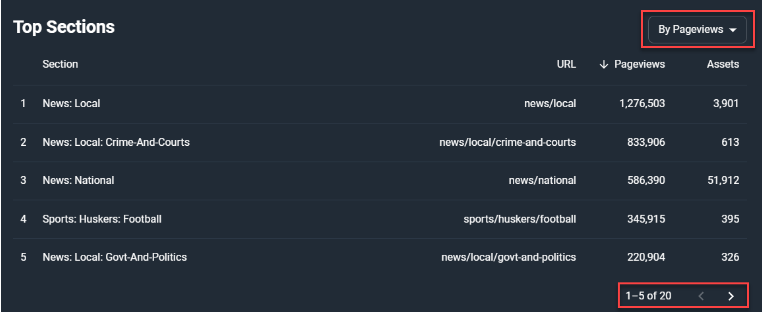
- Top Sections - a table showing Top Sections of sites by either pageviews or assets.
- To change from pageviews to assets click the dropdown in the upper right of the module and select Assets.
- To navigate to another page of results, click the right arrow of the pagination at the bottom of the module.
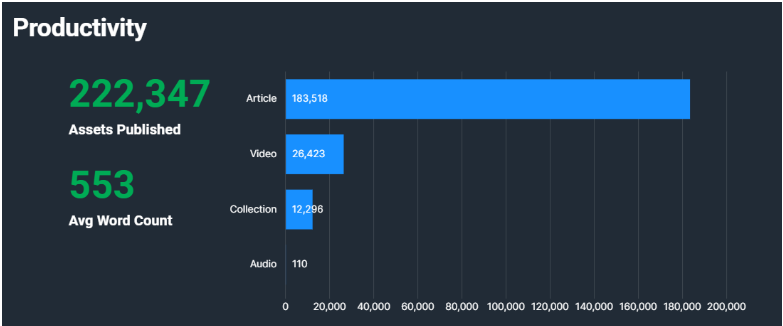
Productivity Section
- Assets Published - the number of assets published in a time period
- Assets Published by type graph - displays the number of assets published in a time period by type
- Avg Word Count - the average number of words available in assets
- Top Content Producers - a table showing Top Content Producers of sites by assets, pageviews or conversion leads.
- To change from assets to pageviews or conversion leads click the dropdown in the upper right of the module and select either Pageviews or Conversion Leads.
- To navigate to another page of results, click the right arrow of the pagination at the bottom of the module.
- The author field is populated by the author name on assets. If there is no author it will show as (not set).
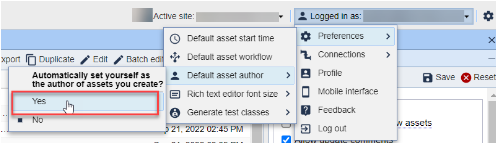
- QUICK TIP: Automatically have an Author listed on all assets by having your team set this default - Click the the 'Logged In as' button in the upper right corner in Blox, hover over 'Preferences', hover over 'Default asset author' and select 'Yes' under 'Automatically set yourself as the author of assets you create?'
- Conversion Leads - this is populated by a Townnews custom event that provides credit to an asset if it was one of the last five assets a user viewed before converting. This is not cross domain and will only populate for clients who have purchases go through Blox Subscriptions or Audience+ customers.