Log In
From the website without an SSO connection:
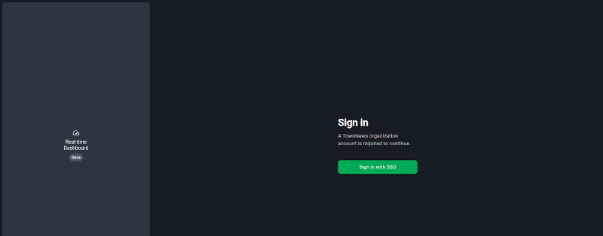
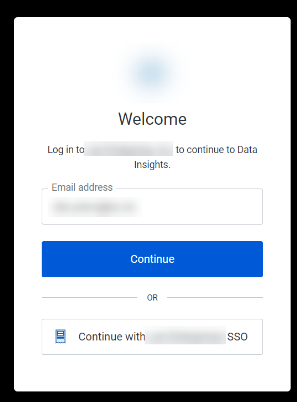
Navigate to trending.live, click ‘Log in with SSO.’
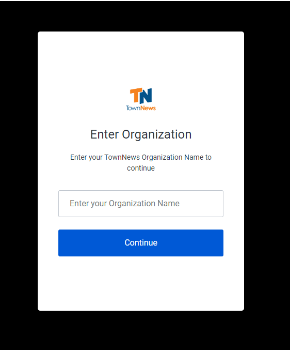
Enter your group organization.
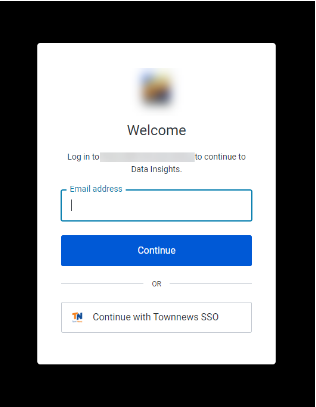
Enter your email address.
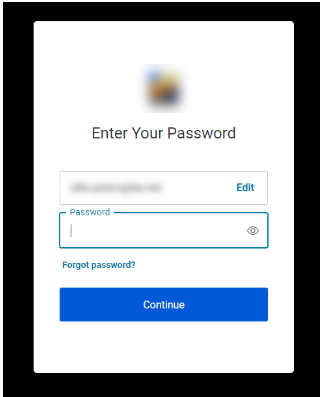
Enter a password and click continue. You should be logged into your account.
Logging in with an SSO connection:
If your company has a Single Sign On Connection set up (Google Workspace, SAML endpoint) it will appear as an option after you enter your Organization name. Click the Continue with ‘Organization’ SSO button and proceed to login with a process that is standard for your company. Once this process is complete, you should be logged in.
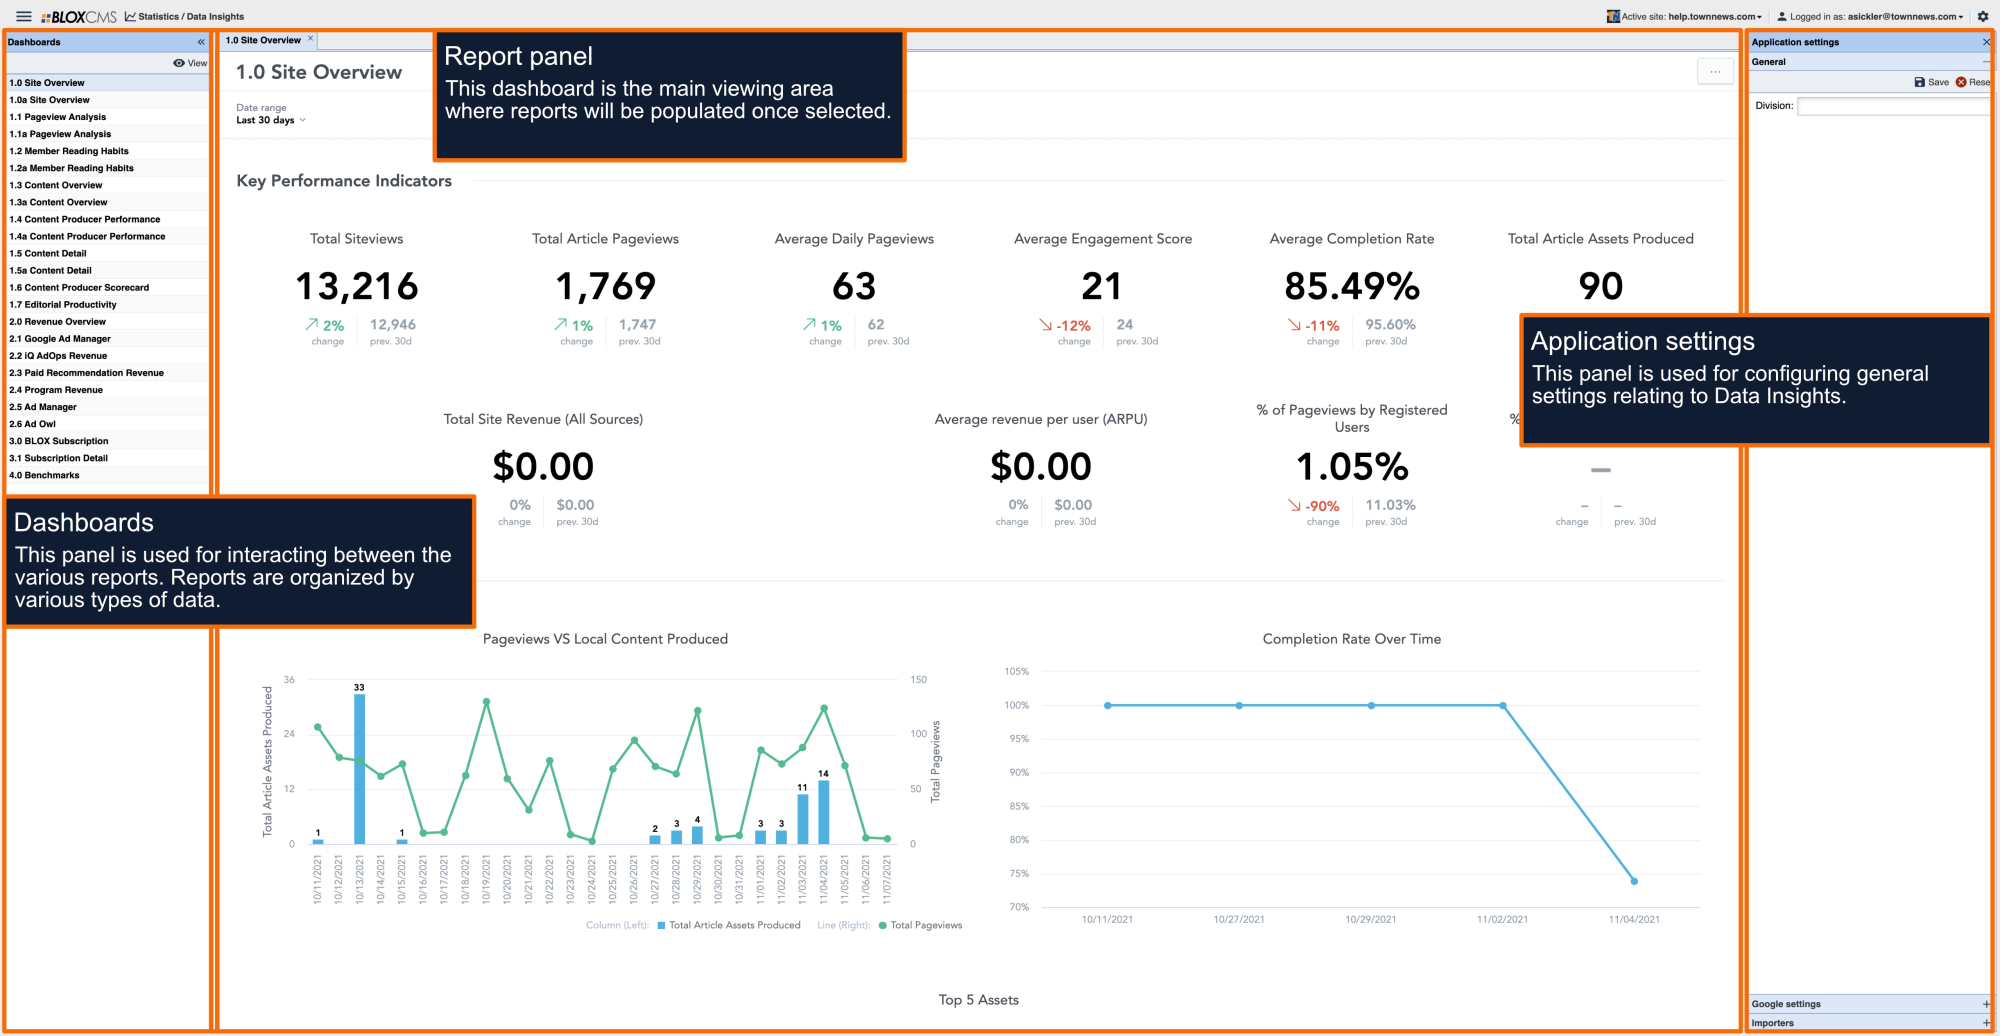
Invite Your Team
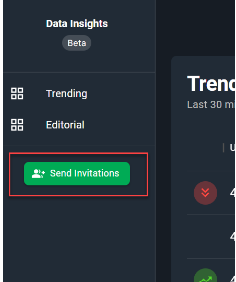
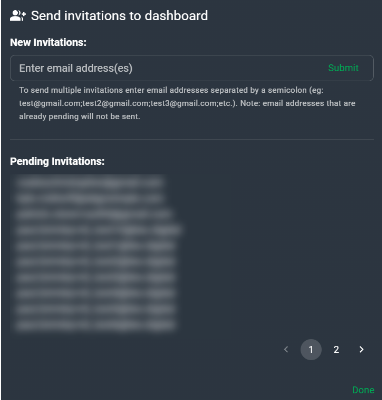
The Invite a User feature lives in the navigation. By clicking the button ‘Send Invitations’ a modal opens up where you can enter email addresses that you would like to invite. You can enter multiple emails here separated by a semicolon to invite multiple users. In this view you can also see Pending Invitations of users who are invited but have not accepted. There is pagination at the bottom of the list. When you are done inviting users click the button ‘Done’ to return to the dashboard.
Set Up Your Default View
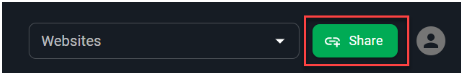
The share link gives you the ability to create a public URL that does not prompt a user to login. The purpose of this is to make the data available to users without having to go through an authentication process and also for easier access for a monitor display.
Another way to use this link is to save your default settings. On the Trending Dashboard, adjust all the filters to your preference then click the share link button. Those filters will now be in place the next time you log in!
Set Up Monitor Display
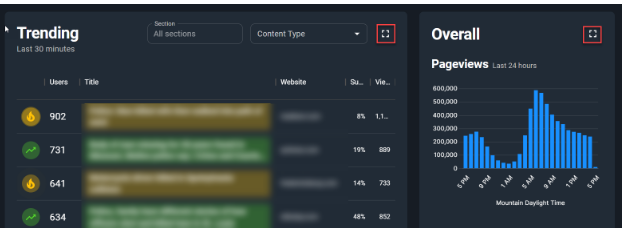
Use a share link from your desktop and open the dashboard on a monitor. To access the monitor view, click the icon next to the Content Type filter in the Trending board. You will also notice this icon in the upper right corner of the Overall section.
Introduce to your Staff
Put the Trending Dashboard up on a monitor in your newsroom and any other location you have a monitor. Explain the monitor view shows active traffic on your website from the last 30 minutes. Then show them how to navigate to this view on their desktop along with the Editorial and Subscription (coming later this month) dashboard.
Build a Data Culture!
Make sure anyone who wants access to this data has it. Encourage them to reference it or ask questions. Try to include a data snapshot in meetings with your teams and celebrate those KPI wins!!!