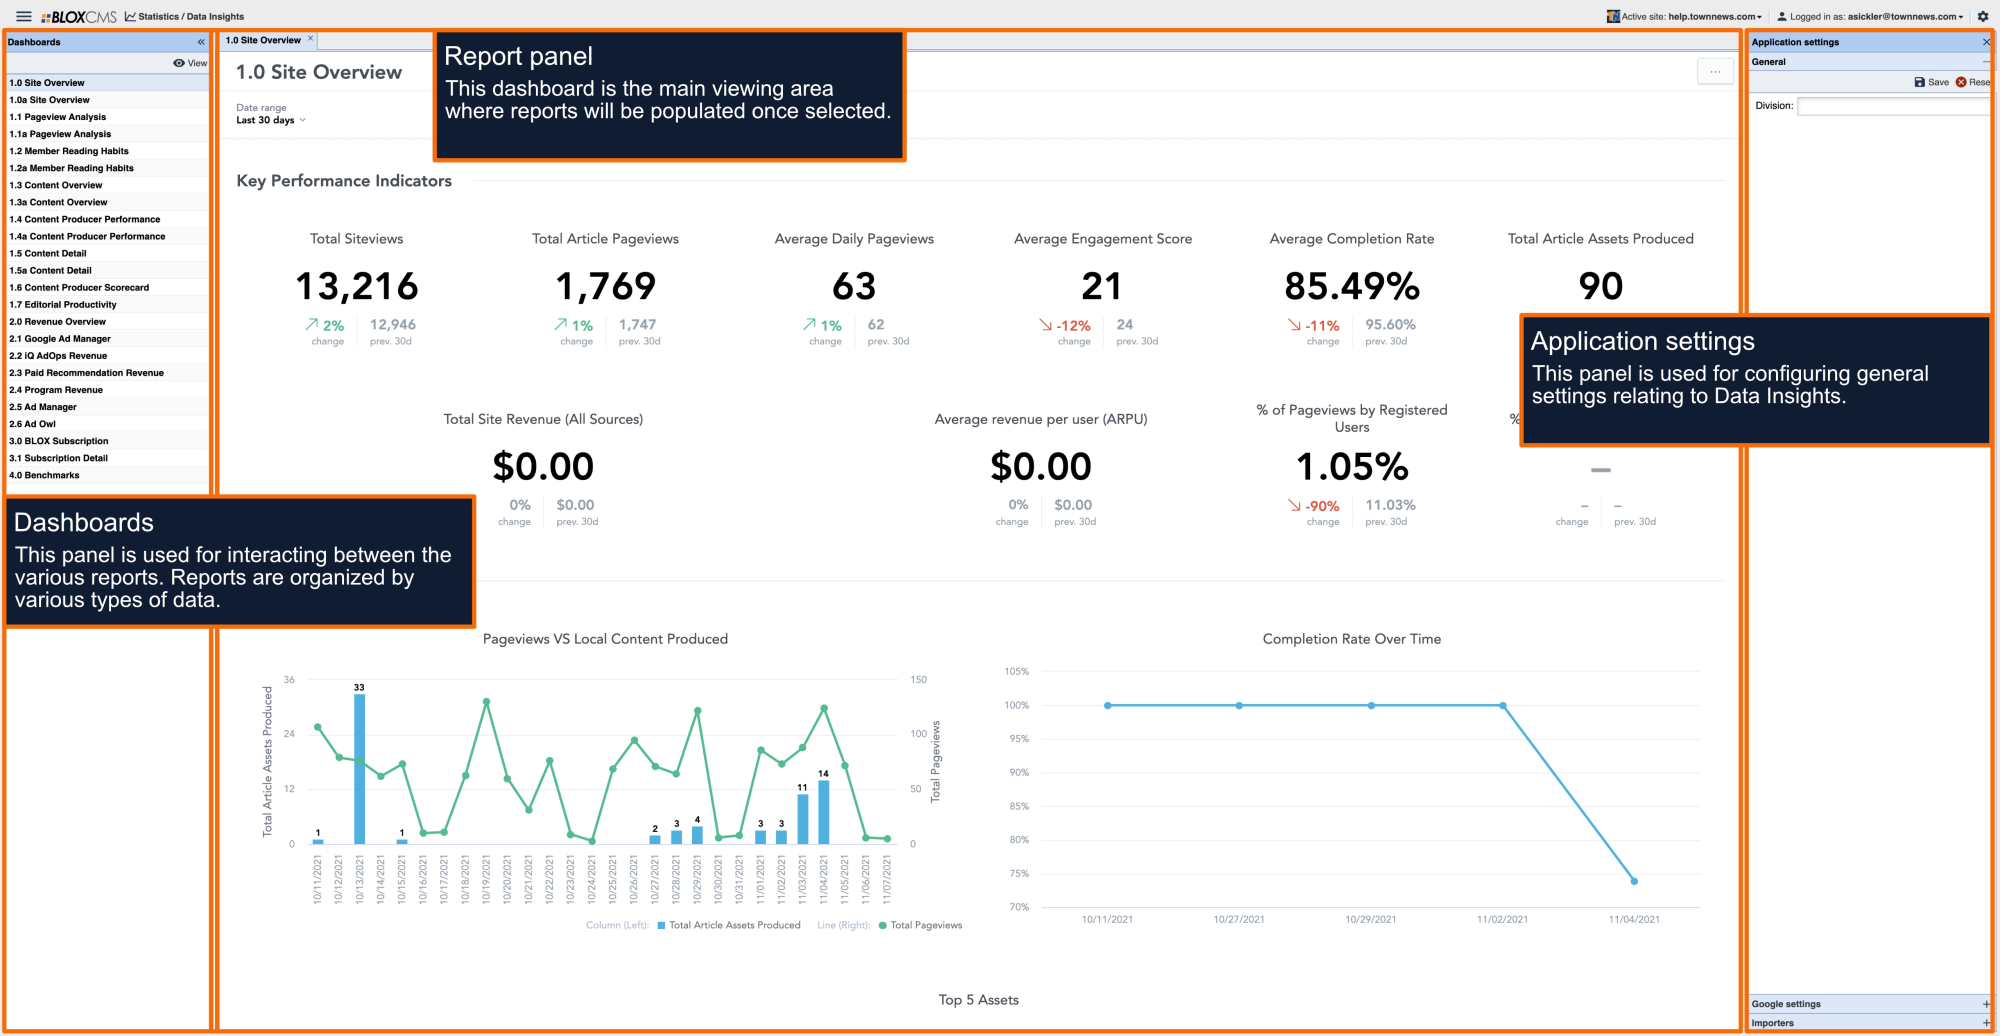
- Displays performance of your site in the last 30 minutes
- Hard refresh every 10 minutes
- UI refresh every 1-5 minutes
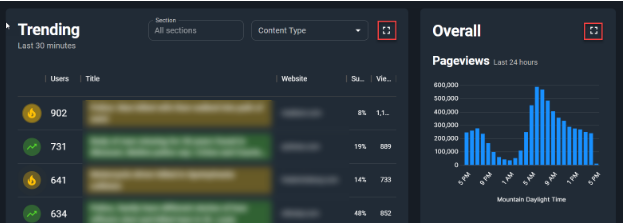
Filters
- Section - this field operates as a text field. You can enter any section on your site such as /business to filter the dashboard. The dropdown options listed are common sections.
- Content Type - this field allows you to filter the Trending board by any Blox asset type. The default is set to Articles. This can be removed as your default by updating your Share Link (directions above) to change your default settings.
When no content types are entered it will display all page traffic which includes section pages, index pages and e-edition pages.
Monitor View
To access the monitor view, click the icon next to the Content Type filter in the Trending board. You will also notice this icon in the upper right corner of the Overall section.
Canonical URLs
If your organization has multiple domains and you utilize syndication, when you are looking at the Trending board with no domain filters in place you will see the canonical URL of an asset.
When you apply a domain filter to the Trending board, the article performance displayed will be relative to the domain in the filter.
Summary:
- Trending board with NO domain filters (default) - displays the canonical URL rolled up to the original source of the article
- Potential User: regional and corporate editorial teams who can identify trending stories across domains. This shows the power of syndication.
- Trending board with domain filters - displays the traffic relative to the domains filtered
- Potential User: local editor
Trending Board Columns and Definitions:
- Users - This is relative to the GA4 Realtime API identifying users.
- Title - This is the title of the asset in your CMS.
- Website - The domain the asset is on.
- If an organization has multiple domains and the dashboard is not filtered down to a specific domain, the website filed will show the domain the story originated from but traffic to any site the story was syndicated to. See Canonical URLs for more information.
- Subscribers - Displays as percentage of users that are a subscriber. This information is passed to the dashboard by a user status event that is subscriber or non-subscriber.
- Views - This is synonymous with pageviews.
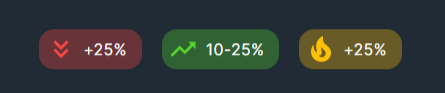
Trending Board Performance Indicator Legend:
- Trending Up - a 10-25% increase in traffic (within the standard deviation) over the last 30 minutes on a rolling 10 minute basis
- Trending Down - More than a 25% decrease in traffic (within the standard deviation) over the last 30 minutes on a rolling 10 minute basis
- On Fire - more than a 25% increase in traffic (within the standard deviation) over the last hour on a rolling 10 minute basis
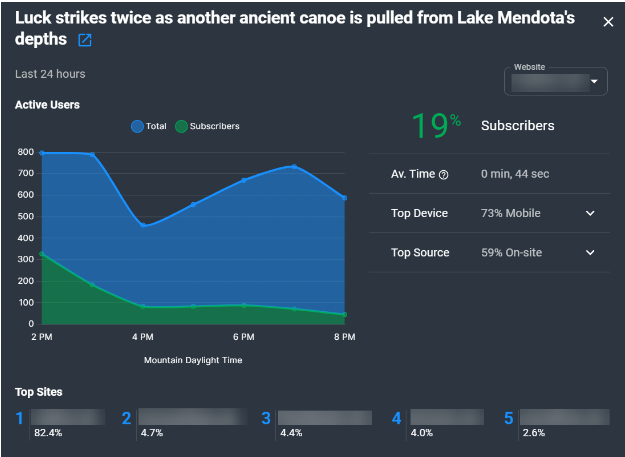
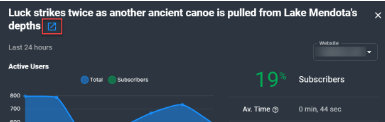
Clickable Headlines Detail
Link to article - found behind the headline in the Clickable Detail view. Displayed as a blue box with an arrow.
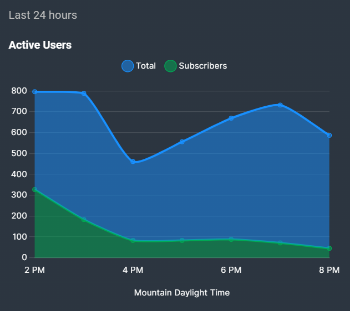
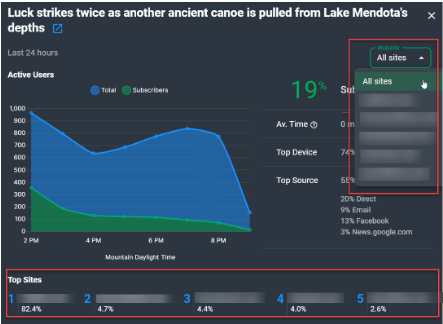
Active Users chart - displays active users across the last 24 hours. If your company has subscriptions it will show users who are subscribers in green. The time zone represented on the graph displays the user's time zone from their browser.
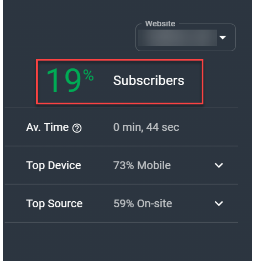
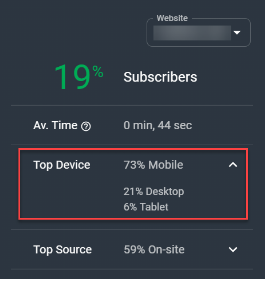
Subscribers - If the company has subscriptions, this field will display the percentage of users who are subscribers.
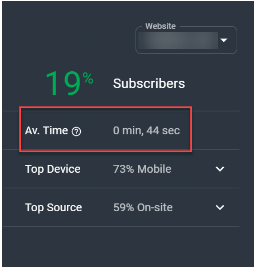
Av.Time - A GA4 metric that calculates the ‘average engagement time per active user’
Top Device - when the arrow is clicked the user can see the breakdown of traffic by device type
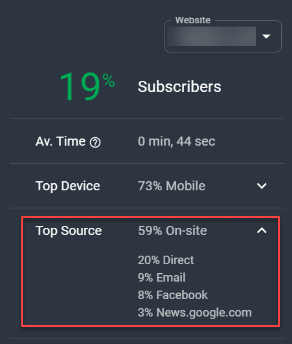
Top Source - when the arrow is clicked the user can see the top five sources of referral traffic
Top Sites - if an organization utilizes syndication, the clickable headline detail will show the percentage of traffic of the top five syndicated sites. Additionally, the user can navigate to each of the syndicated sites within the same modal or select ‘All sites’ for a summary on performance across all sites.