The Total Subscribers KPI showing 8,723 unique active subscriptions representing a 32% increase from the prior 30 day period.
The Total Subscription Revenue KPI showing $950.00 in new and renewing subscription revenue representing a 13% increase from the prior 30 day period.
The New Subscription Revenue KPI showing $950.00 in new subscription revenue representing a 13% increase from the prior 30 day period.
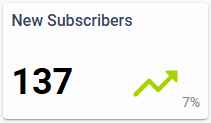
The New Subscribers KPI showing 137 new unique active subscriptions representing a 7% increase from the prior 30 day period.
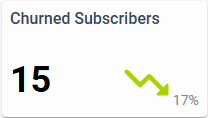
The Churned Subscribers KPI showing 15 subscription terminations representing a 17% decrease from the prior 30 day period.
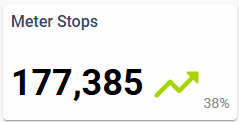
The Meter Stops KPI showing 177,385 unique users that saw a paywall event representing a 38% increase from the prior 30 day period.
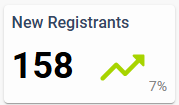
The New Registrants KPI showing 158 unique new user accounts representing a 7% increase from the prior 30 day period.
blox nxt
Contact Key Metric Display
Overview
The Contact Key Metric Display contains several Contact related Key Performance Indicators (KPI) including Total Subscribers, New Subscribers, New Registrants, Churned Subscribers, Meter Stops, Total Subscription Revenue, and New Subscription Revenue.
The following is meant to provide an overview explaining each and, where applicable, an explanation on how it is calculated and where the data is coming from.
📝 All of the Key Metric Display default to a time frame of the last 30 full days. Clicking on the calendar and updating the Start and End Change Date Range does not update this default time frame today.
Total Subscribers
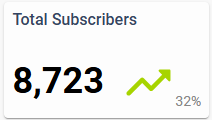
The Total Subscribers KPI showing 8,723 unique active subscriptions representing a 32% increase from the prior 30 day period.
The Total Subscribers KPI displays the total count of unique Active Subscriptions in the last 30 full days.
📝 If a user has multiple services, they will be counted once for each service.
That number is then compared over the previous specified time frame to come up with the percentage increase or decrease on the right.
How is it calculated?
Active Subscriptions are defined as the total count of users’ activated subscriptions in the specified time frame.
Where is the data coming from?
Data is provided from BLOX NXT and is updated daily.
⚠️Subscriptions bound to third-party subscription services will appear after their activation date (the date when the BLOX Subscription transaction was created). For the most accurate measure, partner’s using third-party subscription services should look in their circulation system of record.
New Subscribers
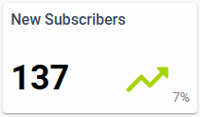
The New Subscribers KPI showing 137 new unique active subscriptions representing a 7% increase from the prior 30 day period.
The New Subscribers KPI displays the total count of unique New Active Subscriptions in the last 30 full days.
That number is then compared over the previous specified time frame to come up with the percentage increase or decrease on the right.
How is it calculated?
New Active Subscriptions are defined as the total count of users’ activated subscriptions in the specified time frame that have not yet renewed.
Where is the data coming from?
Data is provided from BLOX NXT and is updated daily.
⚠️Subscriptions bound to third-party subscription services will appear based on their activation date (the date when the BLOX Subscription transaction was created). For the most accurate measure, partner’s using third-party subscription services should look in their circulation system of record.
New Registrants
The New Registrants KPI showing 158 unique new user accounts representing a 7% increase from the prior 30 day period.
The New Registrants KPI displays the total count of New User Accounts in the last 30 full days.
That number is then compared over the previous specified time frame to come up with the percentage increase or decrease on the right.
How is it calculated?
New User Accounts are defined as the total count of user accounts created in the specified time frame.
Where is the data coming from?
Data is provided from BLOX NXT and is updated daily.
Churned Subscribers
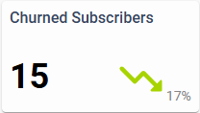
The Churned Subscribers KPI showing 15 subscription terminations representing a 17% decrease from the prior 30 day period.
The Churned Subscribers KPI displays the total count of Subscription Terminations in the last 30 full days.
That number is then compared over the previous specified time frame to come up with the percentage increase or decrease on the right.
How is it calculated?
Subscription Terminations are defined as subscriptions that have canceled, expired, reached the end of their grace period, or otherwise did not renew in the specified time frame.
Where is the data coming from?
Data is provided from BLOX NXT and is updated daily.
⚠️ Subscriptions bound to third-party subscription services will appear after their activation date (the date when the BLOX Subscription transaction was created). Additionally, this metric for third-party services is dependent on users who have logged in after their subscription terminated. For the most accurate measure, partner’s using third-party subscription services should look in their circulation system of record.
Meter Stops
The Meter Stops KPI showing 177,385 unique users that saw a paywall event representing a 38% increase from the prior 30 day period.
The Meter Stops KPI displays the total count of unique Users that saw a paywall (recorded a Meter Stop Event) in the last 30 full days.
That number is then compared over the previous specified time frame to come up with the percentage increase or decrease on the right.
How is it calculated?
Users are defined as a person who interacts with your website, app, product, or feature.
Meter Stop Event is a custom Google Analytics (GA) event (‘view_item_list’) used to track when a user views a paywall on your website.
Where is the data coming from?
Data is provided from the BLOX Google Analytics (GA) instance and is updated daily.
Total Subscription Revenue
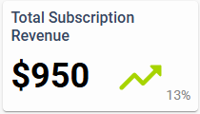
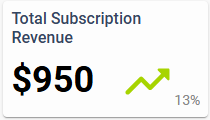
The Total Subscription Revenue KPI showing $950.00 in new and renewing subscription revenue representing a 13% increase from the prior 30 day period.
The Total Subscription Revenue KPI displays the total Transaction Revenue collected at the time of purchase in the last 30 full days.
That number is then compared over the previous specified time frame to come up with the percentage increase or decrease on the right.
How is it calculated?
Transaction Revenue is defined as the total amount of revenue from new subscriptions, combined with the revenue from renewing subscriptions, during the specified time frame, regardless of the subscription's term.
Where is the data coming from?
Data is provided from BLOX NXT and is updated daily.
⚠️ This revenue-related data requires purchases to be collected by BLOX. It will not be available for purchases made through third-party subscription providers.
New Subscription Revenue
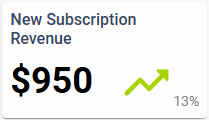
The New Subscription Revenue KPI showing $950.00 in new subscription revenue representing a 13% increase from the prior 30 day period.
The New Subscription Revenue KPI displays the total New Transaction Revenue collected at the time of purchase in the last 30 full days.
That number is then compared over the previous specified time frame to come up with the percentage increase or decrease on the right.
How is it calculated?
New Transaction Revenue is defined as the total amount of revenue from new subscriptions during the specified time frame, regardless of the subscription's term.
Where is the data coming from?
Data is provided from BLOX NXT and is updated daily.
⚠️ This revenue-related data requires purchases to be collected by BLOX. It will not be available for purchases made through third-party subscription providers.