BLOX VMS’s video metrics flow into Google Analytics. If you or your organization already have a Google Analytics account, create a Google Analytics Measurement ID, and BLOX Digital can add it to your BLOX VMS account (please note it is recommended to use a separate Measurement ID from your site Measurement ID at this time).
Under Acquisition, you can see recent information about users.
Under Engagement, you can see data such as average engagement time and recent view data.
Under Events, you can see Google’s default standard event information. Provided you have “Enhanced Measurement” enabled on your Measurement ID, Google provides three standard events: video_start, video_progress, video_complete.
video_start: when the video starts playing. Please note unlike how BLOX VMS tracked live stream views separately in Universal Analytics, they are now combined.
video_progress: when the video progresses past 10%, 25%, 50%, and 75% duration time. Please note Google only logs the generic event by default. To view the actual percentages requires additional configuration (see the section “How to view video progress percentages” below).
video_complete: when the video ends
Change the date range at top right to your previous month to get your video_start totals for the full month.
You can still dig down into these events to get much more information. It does, however, require additional configurations. We hope this guide will help users accustomed to the relative simplicity of Universal Analytics better wrangle all the settings available in GA4.
Tracking video_starts by title
This section describes how to create a report of video views (video_start events) by title of video.
On the left sidebar of GA4, click Explore, then select Blank.
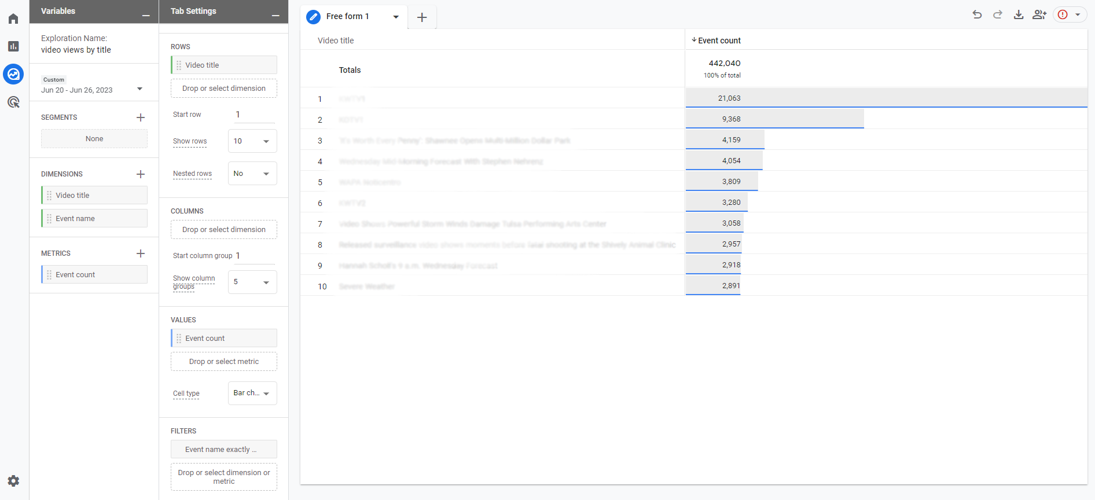
Give your Exploration a useful name, such as “video views by title”.
Set the date range you’d like to view. If you want to review performance monthly, for example, set the first and last days of the previous month. This exploration will save and you can return to it and update the date range each month.
Click the + next to Dimensions, scroll or search, and select “Video title” and “Event name”.
Click the + next to Metrics, scroll or search, and select “Event count”.
In the Tab Settings column set the following:
Under Rows, drag and drop or select the “Video title” dimension
Under Values, drag and drop or select the “Event count” dimension
Under Filters:
You should now have a report of video_start events by title of video.
How to view video progress percentages
This section describes how to monitor your video engagement levels by viewing the breakouts for video_progress.
GA4 by default tracks a video_progress event when a video is watched by more than 10%, 25%, 50%, and 75%. However, it does not display this data by default in the GA4 interface. To correct this, you have to create an event scoped custom dimension. (Please note, your Google Analytics user must have Editor or Administrator permissions to perform the following steps.)
Go to the Admin gear at lower left. Double check you are in the correct Property. Click on “Custom definitions” figure > Custom Definitions > Create custom dimensions and enter the following:
Dimension name: Video percent
Event parameter: video_precent
It will take 24 hours after creating this dimension to start seeing data available in explorations. Note that it will not expose historical data, only new data.
Next, we need to build an exploration to display video_progress values (similar to the above exploration described for video_start).
On the left sidebar of GA4, click Exlore, then select Blank.
Give your Exploration a useful name, such as “video progress”.
Set the date range you’d like to view. If you want to review performance monthly, for example, set the first and last days of the previous month. This exploration will save and you can return to it and update the date range each month.
Click the + next to Dimensions, scroll or search, and select “Video percent” (or if you gave your custom dimension a different name, search for that name) and “Event name”.
Click the + next to Metrics, scroll to or search, and select “Event count”.
In the Tab Settings column set the following:
Under Rows, drag and drop or select the Video percent dimension
Under Values, drag and drop or select the Event Count dimension
Under Filters:
Drag and drop or select “Event name” and set filter “exactly matches”, then select video_progress from the available event expressions. This removes non video_progress events from the report.
Drag and drop or select “Video percent” and set filter “does not exactly match” and enter: (not set). This removes from the report live streams where video_progress on a live event is nonsensical given users may enter at a random point in the stream and the player does not set a progress value.
Drag and drop or select “Video percent” and set filter “does not exactly match” and enter: inf. This removes from the report live streams where video_progress on a live event is nonsensical and progress is considered “infinite”
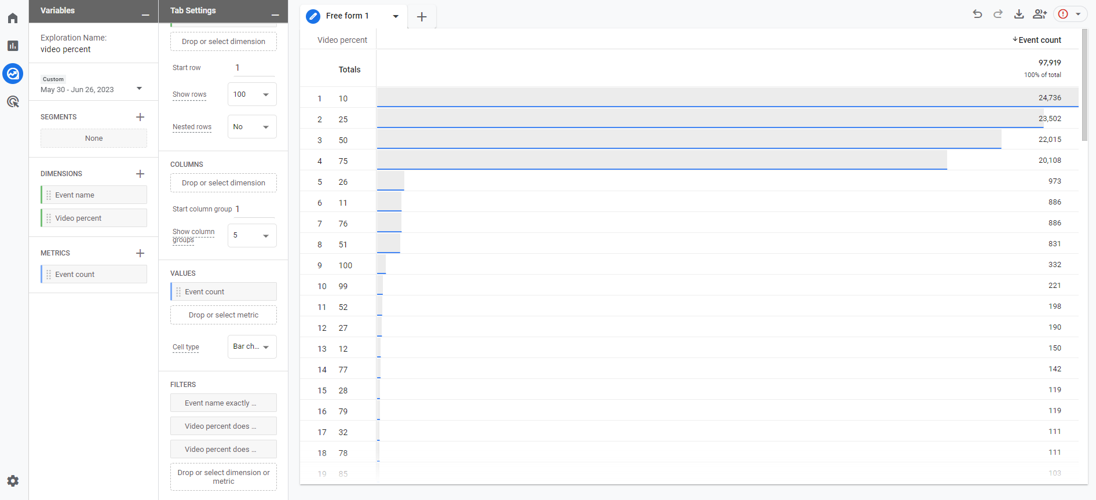
You should now have a report of video_progress events by percentage. Google Analytics default percentage value mileposts that are tracked are 10, 25, 50, 75.
You may also see other values at this time, if the event doesn’t fire exactly at those mileposts, Google records the actual percentage. (BLOX Digital will improve this in the future so it reports the intended milepost even if the event fires slightly later.)
You may also wish to combine the above two explorations and see progress metrics by video title, or for a specific video if you use a “Video title” and “exactly matches” filter.
Frequently asked questions
My view data is different in GA4, why?
Additionally, the way BLOX Digital implements Google Analytics on websites hosted by BLOX Digital involves logging events into the website dataLayer for Google Tag Manager to route to a GA4 property. This is a standard method of passing data but is more susceptible to web browser ad blockers. This may lead to a reduction in reported views via desktop browsers as compared to Universal Analytics.