1. Custom Explorations
A custom exploration is used to display analytics data in an intuitive way. Think of an Exploration as a report with multiple sections grouped by data type. This is accomplished by creating multiple dashboard views of the data that is pertinent to the BLOX CTV app.
- Login to Google Analytics.
- Select the Property for your BLOX CTV App
- Mouse over the menu to the left of the screen and click Explore.
- Click the plus icon above Blank with the text “Create a new exploration”.
2. Dimensions
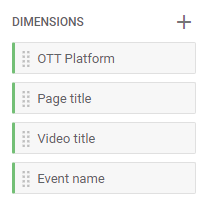
Dimensions are types of data such as OTT Platform(ROKU/Fire TV etc), Page Title, Video Title and Event Name.
2.1 Add Dimensions to Exploration
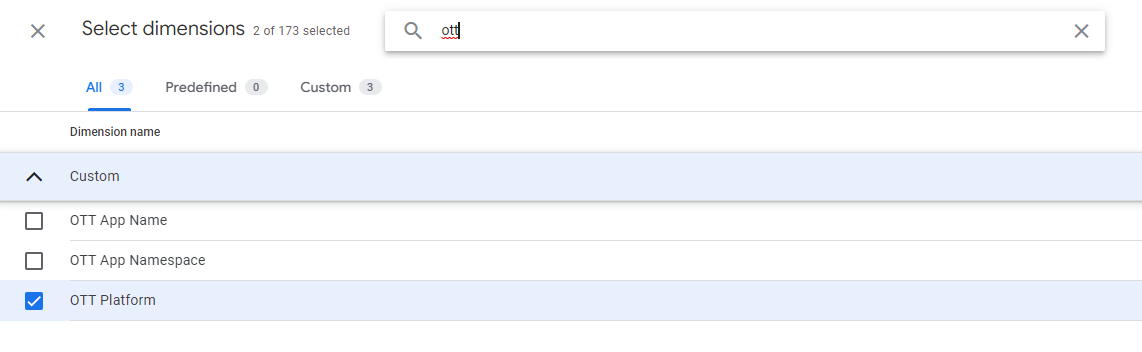
- Click the plus within the Dimensions section, the preceding window appears.
- Within the search box, add the following items one at a time and select the checkbox when found:
- OTT Platform
- Page Title
- Video Title
- Event Name
- When all items are selected, click the Import button.
- The Dimensions section should include all 4 items as pictured below.
3. Metrics
In our dashboards, the Event Count metric signifies the frequency of occurrences for a Dimension item. For example, a Video title Dimension named “Weather Update 6/26” may have 2000 Event count occurrences or views.
3.1 Add Metrics to Exploration
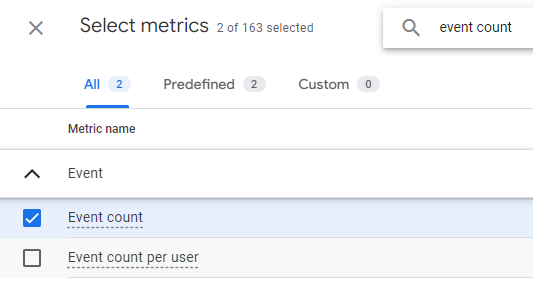
- Click the plus within the Metrics section, the preceding window appears.
- Within the search box, add the following items one at a time and select the checkbox when found:
- Event count
- Views
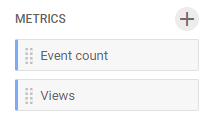
- When all items are selected, click the Import button.
- The Metrics section should include both items as pictured below.
4. Dashboard Tabs
Analytics data is grouped into tabs for easier focus on different data types. For our Exploration 4 tabs will be created: Sections, Platform, Video Views & Video Events.
4.1 Create Sections Report Tab
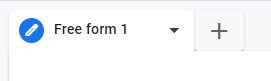
- Click the pencil icon next to the tab titled “Free form 1”
- Enter “Sections” and press tab.
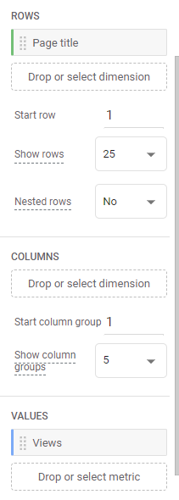
- Drag the Page title dimension onto the dotted box under the Rows section.
- Drag the Views metric onto the dotted box under the Values section.
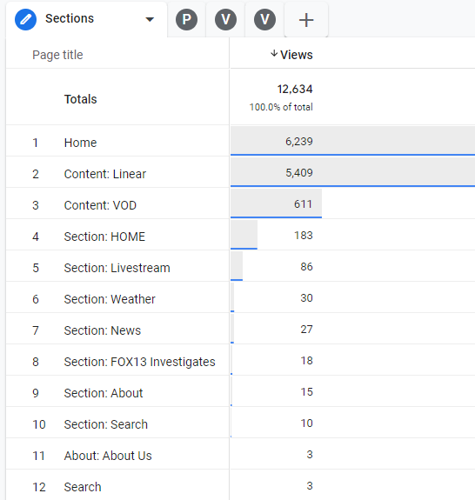
- The Tab settings section should look like the left image below with report data as indicated in the right image.
4.2 Create Platform Report Tab
- Click the plus icon next to the Sections tab just created and select the Free form option.
- Click the pencil icon next to the tab titled “Free form 2”, enter Platform and press tab.
- Drag the OTT Platform dimension onto the dotted box under the Rows section.
- Drag the Event count metric onto the dotted box under the Values section.
4.3 Create Video Views Tab
- Click the plus icon next to the Platform tab just created and select the Free form option.
- Click the pencil icon next to the tab titled “Free form 3”, enter Video Views and press tab.
- Drag the Video title dimension onto the dotted box under the Rows section.
- Drag the Event count metric onto the dotted box under the Values section.
- Drag the Event name dimension to the dotted box under the Filters section in the Tab settings column.
- Within the Filter, select the drop down titled "Select match type" and click "begins with".
- Within the "Enter expression field type video and press tab. (Ignore any prefilled popups that appear)
- Click the Apply button.
4.4 Create Video Events Tab
- Click the plus icon next to the Video Views tab just created and select the Free form option.
- Click the pencil icon next to the tab titled “Free form 4”, enter Video Events and press tab.
- Drag the Event name dimension onto the dotted box under the Rows section.
- Drag the Event count metric onto the dotted box under the Values section.
Drag the Event name dimension to the dotted box under the Filters section in the Tab settings column.
Within the Filter, select the drop down titled "Select match type" and click "begins with".
Within the "Enter expression field type video and press tab. (Ignore any prefilled popups that appear)
Click the Apply button.